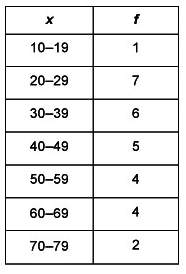
What, if anything, is wrong with the frequency table for this data?
34 21 54 44 33 17...

Mathematics, 11.10.2019 10:30 marelinatalia2000
What, if anything, is wrong with the frequency table for this data?
34 21 54 44 33 17 22 56 78 62
48 25 39 64 70 65 52 43 21 22
46 28 39 76 63 39 42 55 29 30
a.
the frequency table should not have been set up in intervals.
b.
the recorded frequency for the interval 40 - 49 is incorrect.
c.
the recorded frequency for the interval 70 - 79 is incorrect.
d.
the frequency table is correct.

Answers: 2


Another question on Mathematics
Mathematics, 22.06.2019 02:00
Pleasseee important quick note: enter your answer and show all the steps that you use to solve this problem in the space provided. use the circle graph shown below to answer the question. a pie chart labeled favorite sports to watch is divided into three portions. football represents 42 percent, baseball represents 33 percent, and soccer represents 25 percent. if 210 people said football was their favorite sport to watch, how many people were surveyed?
Answers: 1
Mathematics, 22.06.2019 06:00
The soccer team at your school wants to spray paint a design on the middle of the playing field. the design will include this soccer ball. you have been asked to enlarge the drawing of this ball to use for the painting on the field. explain how to accurately enlarge or reduce the size of objects such as the soccer ball.
Answers: 1
You know the right answer?
Questions


Mathematics, 28.03.2020 01:43
Biology, 28.03.2020 01:43
Mathematics, 28.03.2020 01:43
Mathematics, 28.03.2020 01:43

Chemistry, 28.03.2020 01:43

Mathematics, 28.03.2020 01:43

Arts, 28.03.2020 01:43
Biology, 28.03.2020 01:43


