
Mathematics, 14.11.2019 06:31 sarah7484
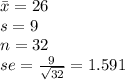
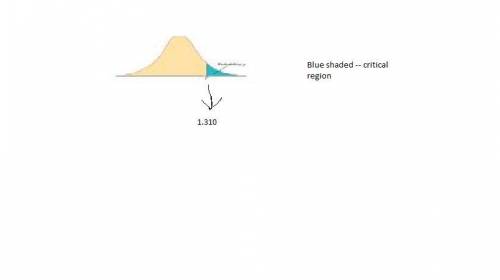
The sample mean and standard deviation from a random sample of 32 observations from a normal population were computed as x¯=26 and s=9. test whether there is enough evidence to infer at the 10% significance level that the population mean is greater than 23. find the critical region. (e. g. t > 1 for a one-tailed test, or t < -1 or t > 1 for a two-tailed test.)

Answers: 2


Another question on Mathematics
Mathematics, 21.06.2019 17:00
Two streets intersect at a 30- degree angle. at the intersection, the are four crosswalks formed that are the same length. what type of quadrilateral is formed by the crosswalks?
Answers: 2
Mathematics, 21.06.2019 20:20
Tomas used 3 1/3 cups of flour and now has 1 2/3cups left. which equation can he use to find f, the number of cups of flour he had to begin with? f+3 1/3=1 2/3 f-3 1/3=1 2/3 3 1/3f=1 2/3 f/3 1/3=1 2/3
Answers: 1
Mathematics, 21.06.2019 20:30
Write an expression that represent sarah’s total pay last week.represent her hourly wage with w monday 5 tuesday 3 wednesday 0 noah hours wednesday 8 only with w wage did noah and sarah earn the same amount last week?
Answers: 3
Mathematics, 22.06.2019 03:00
Describe how the presence of possible outliers might be identified on the following. (a) histograms gap between the first bar and the rest of bars or between the last bar and the rest of bars large group of bars to the left or right of a gap higher center bar than surrounding bars gap around the center of the histogram higher far left or right bar than surrounding bars (b) dotplots large gap around the center of the data large gap between data on the far left side or the far right side and the rest of the data large groups of data to the left or right of a gap large group of data in the center of the dotplot large group of data on the left or right of the dotplot (c) stem-and-leaf displays several empty stems in the center of the stem-and-leaf display large group of data in stems on one of the far sides of the stem-and-leaf display large group of data near a gap several empty stems after stem including the lowest values or before stem including the highest values large group of data in the center stems (d) box-and-whisker plots data within the fences placed at q1 â’ 1.5(iqr) and at q3 + 1.5(iqr) data beyond the fences placed at q1 â’ 2(iqr) and at q3 + 2(iqr) data within the fences placed at q1 â’ 2(iqr) and at q3 + 2(iqr) data beyond the fences placed at q1 â’ 1.5(iqr) and at q3 + 1.5(iqr) data beyond the fences placed at q1 â’ 1(iqr) and at q3 + 1(iqr)
Answers: 1
You know the right answer?
The sample mean and standard deviation from a random sample of 32 observations from a normal populat...
Questions


Computers and Technology, 03.03.2020 02:44

Computers and Technology, 03.03.2020 02:44
Mathematics, 03.03.2020 02:44
Computers and Technology, 03.03.2020 02:44

Mathematics, 03.03.2020 02:44
Mathematics, 03.03.2020 02:45

Mathematics, 03.03.2020 02:45
Social Studies, 03.03.2020 02:45


