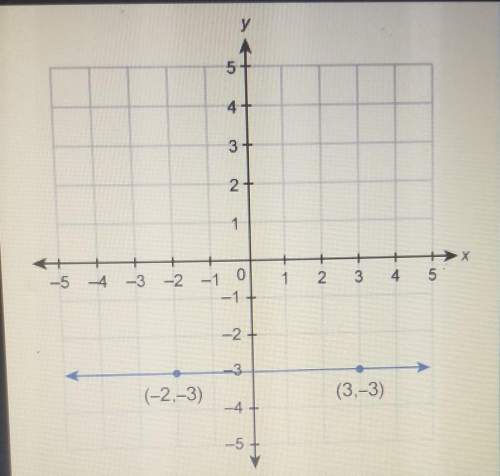
What is the equation of the line shown in this graph?
...

Answers: 1


Another question on Mathematics

Mathematics, 21.06.2019 17:30
Apositive number a or the same number a increased by 50% and then decreased by 50% of the result?
Answers: 3
Mathematics, 21.06.2019 22:50
Listed below are time intervals (min) between eruptions of a geyser. assume that the "recent" times are within the past few years, the "past" times are from around 20 years ago, and that the two samples are independent simple random samples selected from normally distributed populations. do not assume that the population standard deviations are equal. does it appear that the mean time interval has changed? is the conclusion affected by whether the significance level is 0.10 or 0.01? recent 78 90 90 79 57 101 62 87 71 87 81 84 57 80 74 103 62 past 88 89 93 94 65 85 85 92 87 91 89 91 follow the steps of hypothesis testing, including identifying the alternative and null hypothesis, calculating the test statistic, finding the p-value, and making a conclusions about the null hypothesis and a final conclusion that addresses the original claim. use a significance level of 0.10. is the conclusion affected by whether the significance level is 0.10 or 0.01? answer choices below: a) yes, the conclusion is affected by the significance level because h0 is rejected when the significance level is 0.01 but is not rejected when the significance level is 0.10. b) no, the conclusion is not affected by the significance level because h0 is not rejected regardless of whether a significance level of 0.10 or 0.01 is used. c) yes, the conclusion is affected by the significance level because h0 is rejected when the significance level is 0.10 but is not rejected when the significance level is 0.01. d) no, the conclusion is not affected by the significance level because h0 is rejected regardless of whether a significance level of 0.10 or 0.01 is used.
Answers: 3
Mathematics, 22.06.2019 01:30
Given are five observations for two variables, x and y. xi 1 2 3 4 5 yi 3 7 5 11 14 which of the following is a scatter diagrams accurately represents the data? what does the scatter diagram developed in part (a) indicate about the relationship between the two variables? try to approximate the relationship betwen x and y by drawing a straight line through the data. which of the following is a scatter diagrams accurately represents the data? develop the estimated regression equation by computing the values of b 0 and b 1 using equations (14.6) and (14.7) (to 1 decimal). = + x use the estimated regression equation to predict the value of y when x = 4 (to 1 decimal). =
Answers: 3
Mathematics, 22.06.2019 03:30
At the movie theatre, child admission is $5.20 and adult admission is $9.70. on sunday three time as many adult tickets as child tickets were sold, for a total sales of $788.90. how many child tickets were sold that day?
Answers: 1
You know the right answer?
Questions


Computers and Technology, 31.08.2019 02:30
Computers and Technology, 31.08.2019 02:30


Computers and Technology, 31.08.2019 02:30
Mathematics, 31.08.2019 02:30

Physics, 31.08.2019 02:30
History, 31.08.2019 02:30

Advanced Placement (AP), 31.08.2019 02:30
Social Studies, 31.08.2019 02:30


