
Mathematics, 18.11.2019 21:31 bsweeney3328
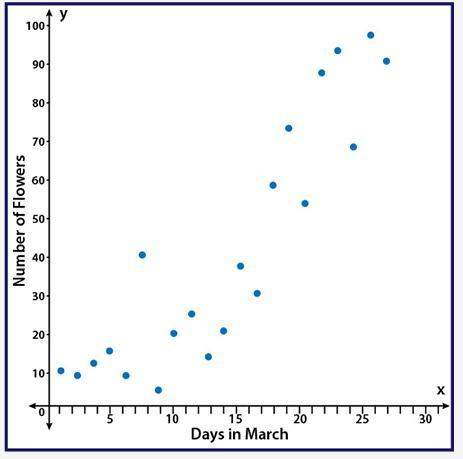
The scatter plot shows the number of flowers that have bloomed in the garden during the month of march:
(scatter plot shown in picture below)
part a: using computer software, a correlation coefficient of r = 0.98 was calculated. based on the scatter plot, is that an accurate value for this data? why or why not? (5 points)
part b: instead of comparing the number of flowers and the day in march, write a scenario that would be a causal relationship for flowers in a garden. (5 points)

Answers: 2


Another question on Mathematics
Mathematics, 21.06.2019 14:20
Triangle abc is reflected over the line y=x triangle abc has points (-6,-,-1) and (-5,-6) what is the c coordinate
Answers: 1
Mathematics, 21.06.2019 17:00
Given that ot =5, xt=12, and ox= 13 is xy tangent to circle o at t? explain.
Answers: 1
Mathematics, 21.06.2019 20:30
Erin bought christmas cards for $2 each to send to her family and friends. which variable is the dependent variable?
Answers: 1
Mathematics, 22.06.2019 00:30
Examine this system of equations. what integer should the second equation be multiplied by so that when the two equations are added together, the x term is eliminated? 3/4x+1/7y=6 1/8x-3/5y=16
Answers: 3
You know the right answer?
The scatter plot shows the number of flowers that have bloomed in the garden during the month of mar...
Questions

Arts, 29.09.2020 01:01


Computers and Technology, 29.09.2020 01:01
Biology, 29.09.2020 01:01
Biology, 29.09.2020 01:01
Mathematics, 29.09.2020 01:01


Geography, 29.09.2020 01:01

History, 29.09.2020 01:01
Mathematics, 29.09.2020 01:01
Mathematics, 29.09.2020 01:01
Mathematics, 29.09.2020 01:01


