table a

Mathematics, 28.12.2019 08:31 northpolea
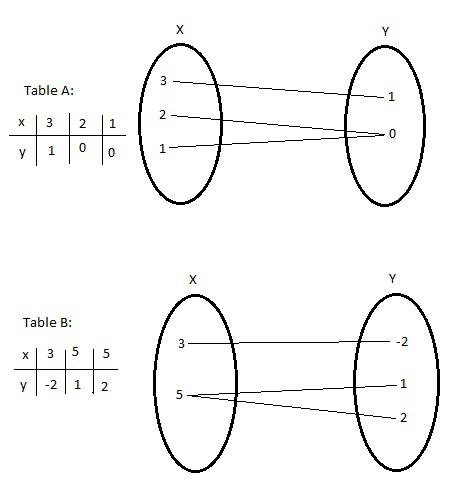
The tables below show the values of y corresponding to different values of x:
table a
x
3 2 1
y
1 0 0
table b
x
3 5 5
y
−2 1 2
which statement is true for the tables?
both table a and table b represent functions.
both table a and table b do not represent functions.
table a does not represent a function, but table b represents a function.
table a represents a function, but table b does not represent a function.

Answers: 3


Another question on Mathematics
Mathematics, 21.06.2019 18:10
which of the following sets of data would produce the largest value for an independent-measures t statistic? the two sample means are 10 and 20 with variances of 20 and 25 the two sample means are 10 and 20 with variances of 120 and 125 the two sample means are 10 and 12 with sample variances of 20 and 25 the two sample means are 10 and 12 with variances of 120 and 125
Answers: 2
Mathematics, 21.06.2019 19:00
Lena reflected this figure across the x-axis. she writes the vertices of the image as a'(−2, 8), b'(−5, 6), c'(−8, 8), d'(−4, 2).
Answers: 2
Mathematics, 22.06.2019 01:00
Suppose the equation ||x-a|-b|=2008 has 3 distinct real roots and a not =0. find the value of b.
Answers: 1
Mathematics, 22.06.2019 02:00
Asix-sided die of unknown bias is rolled 20 times, and the number 3 comes up 6 times. in the next three rounds (the die is rolled 20 times in each round), the number 3 comes up 6 times, 5 times, and 7 times. the experimental probability of rolling a 3 is 10 %, which is approximately % more than its theoretical probability. (round off your answers to the nearest integer.)
Answers: 1
You know the right answer?
The tables below show the values of y corresponding to different values of x:
table a
table a
Questions

History, 28.07.2019 22:30
Mathematics, 28.07.2019 22:30
Mathematics, 28.07.2019 22:30
Mathematics, 28.07.2019 22:30
Mathematics, 28.07.2019 22:30

Social Studies, 28.07.2019 22:30

History, 28.07.2019 22:30


Social Studies, 28.07.2019 22:30
Social Studies, 28.07.2019 22:30
Chemistry, 28.07.2019 22:30
Mathematics, 28.07.2019 22:30

Geography, 28.07.2019 22:30


