
Mathematics, 27.11.2019 00:31 Tyrant4life
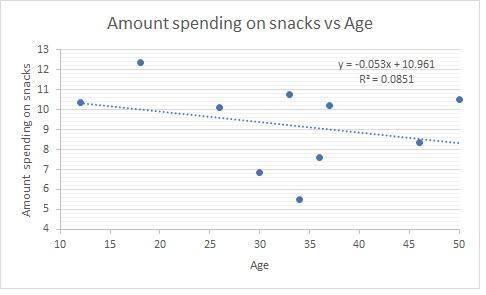
Answer the following questions using the data given below. moviegoer spending on snacks (n = 10) age (x) ($) spent (y) 30 6.85 50 10.50 34 5.50 12 10.35 37 10.20 33 10.75 36 7.60 26 10.10 18 12.35 46 8.35 use excel to make a scatter plot of the data. select the data points, right-click, select add trendline, select the options tab, and choose display equation on chart and display r-squared value on chart.

Answers: 3


Another question on Mathematics
Mathematics, 21.06.2019 22:20
Which strategy is used by public health to reduce the incidence of food poisoning?
Answers: 1
Mathematics, 21.06.2019 23:00
Describe the end behavior of the function below. f(x)=(2/3)^x-2 a. as x increases, f(x) approaches infinity. b. as x decreases, f(x) approaches 2. c. as x increases, f(x) approaches -2. d. as x decreases, f(x) approaches negative infinity.
Answers: 1
Mathematics, 21.06.2019 23:00
If a company produces x units of an item at a cost of $35 apiece the function c=35x is a of the total production costs
Answers: 2
You know the right answer?
Answer the following questions using the data given below. moviegoer spending on snacks (n = 10) age...
Questions

History, 12.10.2020 14:01

Mathematics, 12.10.2020 14:01
Mathematics, 12.10.2020 14:01

Chemistry, 12.10.2020 14:01
Mathematics, 12.10.2020 14:01
English, 12.10.2020 14:01

Physics, 12.10.2020 14:01
English, 12.10.2020 14:01
Mathematics, 12.10.2020 14:01


