Mathematics, 30.11.2019 19:31 harpermags7830
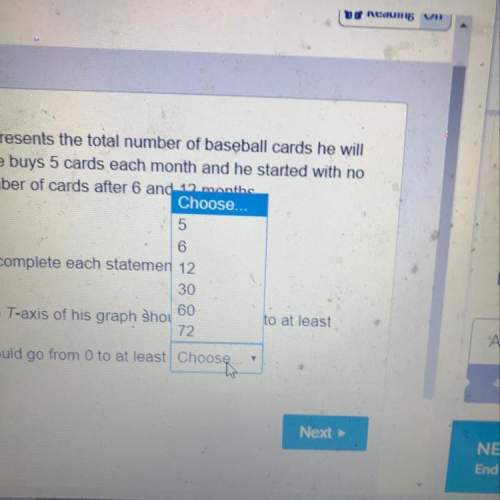
Mohammad would like to graph the line that represents the total number of baseball cards he will
have collected, t, after m months, given that he buys 5 cards each month and he started with no
cards. he would like the graph to show the number of cards after 6 and 12 months
select from the drop-down menus to correctly complete each statement
to best show this information, the scale for the t-axis of his graph should go from 0 to at least
(answer)
and the m-axis of his graph should go from 0 to at least (answer)


Answers: 1


Another question on Mathematics

Mathematics, 21.06.2019 17:30
The sales totals at macy's food store have increased exponentially over the months. which of these best shows the sales in the first three months?
Answers: 2

Mathematics, 21.06.2019 18:20
The length of a rectangle plus its width is 25 cm. the area is 156 square cm. what are the length and width of the rectangle? separate the answers with a comma.
Answers: 3

Mathematics, 21.06.2019 18:30
Do some research and find a city that has experienced population growth. determine its population on january 1st of a certain year. write an exponential function to represent the city’s population, y, based on the number of years that pass, x after a period of exponential growth. describe the variables and numbers that you used in your equation.
Answers: 3

Mathematics, 21.06.2019 19:00
You earn a 12% commission for every car you sell. how much is your commission if you sell a $23,000 car?
Answers: 1
You know the right answer?
Mohammad would like to graph the line that represents the total number of baseball cards he will
Questions


Mathematics, 09.07.2020 01:01


Mathematics, 09.07.2020 01:01


Mathematics, 09.07.2020 01:01


English, 09.07.2020 01:01


Mathematics, 09.07.2020 01:01


 then
then  cards.
 then
then  cards.

