
Mathematics, 02.12.2019 20:31 oscaryn7213
The graph below shows the distance, y, in miles, of a bird from its nest for a certain amount of time, x, in minutes:
graph titled distance vs time is shown with time in minutes along the x-axis and distance from nest in miles along the y-axis. the scale on the x-axis shows the numbers 0 to 25 at increments of 5, and the scale on the y-axis shows the numbers 1 to 8 at increments of 1. a straight line joins the ordered pairs 0, 3 and 5, 4 and 10, 5 and 15, 6 and 20, 7.
based on the graph, what is the initial value of the graph and what does it represent?
3 miles per minute; it represents the speed of the bird
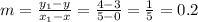
0.2 mile per minute; it represents the speed of the bird
0.2 mile; it represents the original distance of the bird from its nest
3 miles; it represents the original distance of the bird from its nest

Answers: 3
 miles per minute represents the speed of the bird and 3 miles represents the original distance of the bird from its nest.
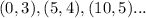
 and
and 

 , y-axis is the distance so in
  minutes the the distance covered by the bird must be equal to to y-axis value which is
  miles.
 the bird has started from y-intercept value
  so we can say that,the original distance of the bird from its nest is
  .
. and
and 
 per minute and is

Another question on Mathematics
Mathematics, 21.06.2019 14:50
Which equations represents circles that have a diameter of 12 units and a center that lies on the y-axis? check all that apply
Answers: 1
Mathematics, 21.06.2019 21:00
Oliver read for 450 minutes this month his goal was to read for 10% more minutes next month if all of her medicine go how many minutes will you read all during the next two months
Answers: 3
Mathematics, 21.06.2019 22:00
Write an inequality for this description. - one fourth of the opposite of the difference of five and a number is less than twenty.
Answers: 1
Mathematics, 21.06.2019 22:30
My hour hand points between the 8 and the 9 in 35 minutes it will be the next hour. what time is it ?
Answers: 2
You know the right answer?
The graph below shows the distance, y, in miles, of a bird from its nest for a certain amount of tim...
Questions

Mathematics, 05.01.2020 00:31

Social Studies, 05.01.2020 00:31
Mathematics, 05.01.2020 00:31

Physics, 05.01.2020 00:31


Mathematics, 05.01.2020 00:31

Geography, 05.01.2020 00:31
History, 05.01.2020 00:31

Mathematics, 05.01.2020 00:31
Mathematics, 05.01.2020 00:31
Mathematics, 05.01.2020 00:31
Social Studies, 05.01.2020 00:31
Mathematics, 05.01.2020 00:31


