
Mathematics, 05.12.2019 07:31 granthazenp5e9mj
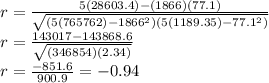
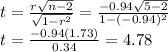
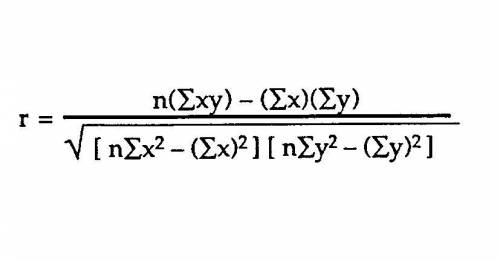
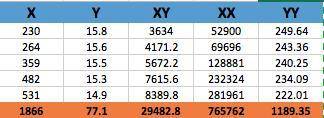
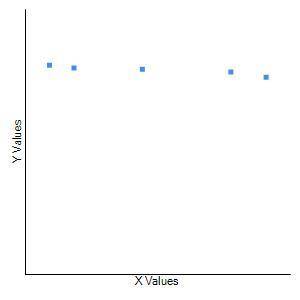
Listed below are annual data for various years. the data are weights (metric tons) of imported lemons and car crash fatality rates per 100,000 population. construct a scatterplot, find the value of the linear correlation coefficient r, and find thep-value using α=0.05. is there sufficient evidence to conclude that there is a linear correlation between lemon imports and crash fatality rates? do the results suggest that imported lemons cause car fatalities?
lemon_imports_(x) crash_fatality_rate_(y)
230 15.8
264 15.6
359 15.5
482 15.3
531 14.9
what are the null and alternative hypotheses?

Answers: 1


Another question on Mathematics
Mathematics, 21.06.2019 19:30
Which of the following is the explicit rule for a geometric sequence defined a recursive formula of a -5a for which the first term is 23?
Answers: 1
Mathematics, 21.06.2019 20:10
What additional information could be used to prove abc =mqr using sas? check all that apply.
Answers: 1
Mathematics, 21.06.2019 20:30
1) you deposit $2,500 in an account that earns 4% simple interest. how much do you earn in eight years?
Answers: 1
Mathematics, 22.06.2019 00:30
3c2 + 2d)(–5c2 + d) select all of the partial products for the multiplication problem above.
Answers: 2
You know the right answer?
Listed below are annual data for various years. the data are weights (metric tons) of imported lemon...
Questions

Spanish, 01.07.2020 16:01

History, 01.07.2020 16:01

Mathematics, 01.07.2020 16:01

Mathematics, 01.07.2020 16:01

Mathematics, 01.07.2020 16:01
History, 01.07.2020 16:01


