
Mathematics, 07.12.2019 02:31 zoewilliamss26
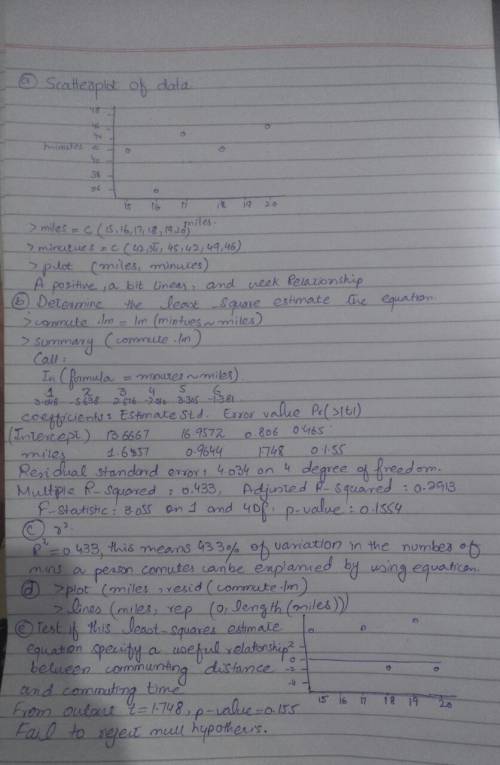
The following data is looking at how long it takes to get to work. let x = commuting distance (miles) and y = commuting time (minutes) x 15 16 17 18 19 20 y 42 35 45 42 49 46
a. give a scatterplot of this data and comment on the direction, form and strength of this relationship.
b. determine the least-squares estimate equation for this data set.
c. give the r2, comment on what that means.
d. give the residual plot based on the least-squares estimate equation.
e. test if this least-squares estimate equation specify a useful relationship between commuting distance and commuting time.

Answers: 2


Another question on Mathematics
Mathematics, 21.06.2019 15:30
The triangles are similar. what is the value of x? show your work.
Answers: 1
Mathematics, 21.06.2019 19:30
Consider that lines b and c are parallel. what is the value of x? what is the measure of the smaller angle?
Answers: 1
You know the right answer?
The following data is looking at how long it takes to get to work. let x = commuting distance (miles...
Questions


English, 15.04.2020 19:22


Chemistry, 15.04.2020 19:22
Mathematics, 15.04.2020 19:22

Social Studies, 15.04.2020 19:22


