
Mathematics, 09.12.2019 07:31 phancharamachasm
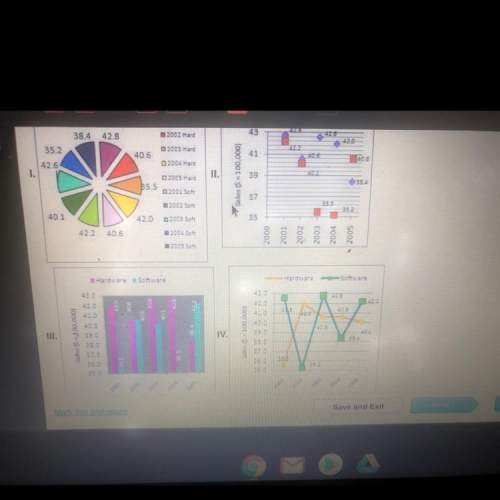
Will works for a company which produces both computer hardware and computer software. he is preparing for a meeting with his boss. he has been asked to compile sales data from a five-year period for both hardware and software sales. the data will has gathered is in the table below, but it is scrambled and hard to read. sales are in hundreds of thousands of dollars. "h" and
"s" indicate hardware and software, respectively.
year | 2003 | 2004 | 2002 |
sales| 35.5 | 42.0 | 40.6 |
div. | s | h | h |
continued..
2005| 2002 | 2003 | 2004|
40.6 | 40.1 | 42.6 | 35.2 |
s | s | h | s |
| 2001 | 2005 | 2001 |
| 42.8 | 38.4 | 42.2 |
| h | h | s |
in order to make this data more readable, will has decided to put it into a graph. which of the following graphs accurately
represents this data?
a. l
b. ll
c. lll
d. lv

Answers: 1


Another question on Mathematics
Mathematics, 21.06.2019 19:30
How long must $542 be invested at a rate of 7% to earn $303.52 in interest? in a easier way
Answers: 1
Mathematics, 21.06.2019 19:40
Which is the solution to the inequality? 2 3/52 1/15 b< 3 2/15 b> 3 2/15
Answers: 1
Mathematics, 21.06.2019 20:30
Evaluate the expression for the given value of the variable. | ? 4 b ? 8 | + ? ? ? 1 ? b 2 ? ? + 2 b 3 -4b-8+-1-b2+2b3 ; b = ? 2 b=-2
Answers: 2
Mathematics, 21.06.2019 21:00
*let m∠cob = 50°30’, m∠aob = 70° and m∠aoc = 20°30’. could point c be in the interior of ∠aob? why?
Answers: 1
You know the right answer?
Will works for a company which produces both computer hardware and computer software. he is preparin...
Questions
Mathematics, 09.07.2019 22:30
Mathematics, 09.07.2019 22:30

Social Studies, 09.07.2019 22:30

History, 09.07.2019 22:30

History, 09.07.2019 22:30

Chemistry, 09.07.2019 22:30
Mathematics, 09.07.2019 22:30

Mathematics, 09.07.2019 22:30
Mathematics, 09.07.2019 22:30
Mathematics, 09.07.2019 22:30


