
Mathematics, 10.12.2019 02:31 bks53
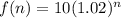
Ascientist is studying the growth of a particular species of plant. he writes the following equation to show the height of the plant f(n), in cm, after n days:
f(n) = 10(1.02)n
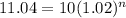
part a: when the scientist concluded his study, the height of the plant was approximately 11.04 cm. what is a reasonable domain to plot the growth function?
part b: what does the y-intercept of the graph of the function f(n) represent?
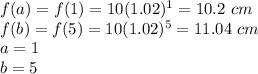
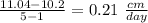
part c: what is the average rate of change of the function f(n) from n = 1 to n = 5, and what does it represent?

Answers: 2


 ----> initial value or y-intercept (value of he function when the value of n is equal to zero)
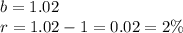
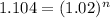
![log(1.104)=n[log(1.02)]](/tpl/images/0411/0016/89a19.png)


Another question on Mathematics
Mathematics, 21.06.2019 13:40
Cam bought some used books for $4.95. he paid $0.50 each for some books and $0.35 each for the others. he bought fewer than 8 books at each price. how many books did cam buy?
Answers: 1
Mathematics, 21.06.2019 17:40
Divide. reduce the answer to lowest terms.5 2/3 ÷ 3 1/9
Answers: 3
Mathematics, 21.06.2019 18:00
Need on this geometry question. explain how you did it.
Answers: 1
Mathematics, 21.06.2019 18:40
Solve the equation below: (x+4)/6x=1/x a. x=2 b. x=0,2 c. x=-2 d. x=0,-2
Answers: 1
You know the right answer?
Ascientist is studying the growth of a particular species of plant. he writes the following equation...
Questions

History, 05.02.2021 22:00
History, 05.02.2021 22:00


Arts, 05.02.2021 22:00

English, 05.02.2021 22:00

Computers and Technology, 05.02.2021 22:00

Computers and Technology, 05.02.2021 22:00


