
Mathematics, 10.12.2019 08:31 zaniathomasel
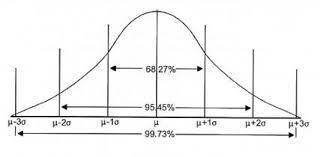
The graph represents the distribution of the number of questions answered correctly on a 50-question math test. a graph shows the horizontal axis numbered 24 to x. the vertical axis is unnumbered. the graph shows an upward trend from 24 to 36 then a downward trend from 36 to 48. what is the standard deviation of the data?
a)4
b)8
c)12
d)24

Answers: 1


Another question on Mathematics
Mathematics, 21.06.2019 13:50
Asimple random sample of size nequals14 is drawn from a population that is normally distributed. the sample mean is found to be x overbar equals 70 and the sample standard deviation is found to be sequals13. construct a 90% confidence interval about the population mean
Answers: 2
Mathematics, 21.06.2019 17:00
Benito is selecting samples of five values from the table, which row will result in the greatest mean? population data row 1 4 2 2 3 3 row 2 3 3 4 3 2 row 3 2 4 3 4 3 row 4 3 4 4 7 3 row 1 row 2 r
Answers: 3
Mathematics, 21.06.2019 19:10
If $740 is invested at an interest rate of 11% per year and is compounded continuously, how much will the investment be worth in 7 years? use the continuous compound interest formula a = pert.
Answers: 1
Mathematics, 21.06.2019 20:00
Mario has $14.35 left in his wallet. he spent $148.43 for tablecloths. then, he spent $92.05 for napkins. how much money did mario have in his wallet to start with?
Answers: 2
You know the right answer?
The graph represents the distribution of the number of questions answered correctly on a 50-question...
Questions


Health, 24.07.2019 22:00
History, 24.07.2019 22:00


Mathematics, 24.07.2019 22:00


Mathematics, 24.07.2019 22:00


