
Mathematics, 14.12.2019 04:31 v4leriaaa
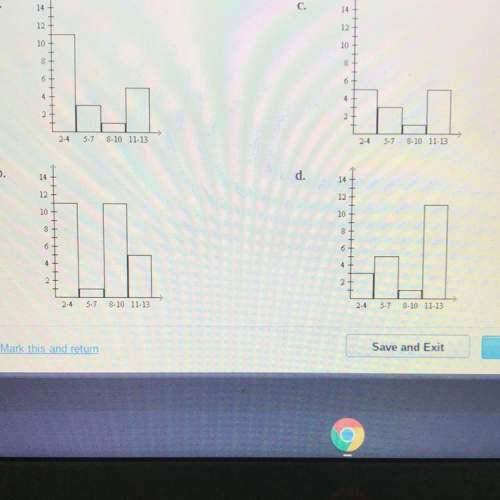
Draw a histogram for the intervals 2-4, 5-7, 8-10, and 11-13 using the following data: 11, 3, 13, 4, 2, 2, 13, 3, 6, 4, 6, 11, 4, 13, 7, 3, 3, 3, 10,2
select the best answer from the choices provided

Answers: 1


Another question on Mathematics
Mathematics, 21.06.2019 21:00
Awater tank holds 18000 gallons. how long will it take for the water level to reach 6000 gallons if the water is used at anaverage rate of 450 gallons per day
Answers: 1
Mathematics, 21.06.2019 21:30
Look at triangle wxy what is the length (in centimeters) of the side wy of the triangle?
Answers: 1
Mathematics, 22.06.2019 00:20
Traffic on saturday, it took ms. torres 24 minutes to drive 20 miles from her home to her office. during friday's rush hour, it took 75 minutes to drive the same distance. a. what was ms. torres's average speed in miles per hour on saturday? b. what was her average speed in miles per hour on friday?
Answers: 1
Mathematics, 22.06.2019 00:50
What is a correct first step in solving the inequality-4(3-5x)> -6x+9
Answers: 2
You know the right answer?
Draw a histogram for the intervals 2-4, 5-7, 8-10, and 11-13 using the following data: 11, 3, 13, 4...
Questions
Mathematics, 16.12.2021 17:30
Mathematics, 16.12.2021 17:30
Mathematics, 16.12.2021 17:30
Mathematics, 16.12.2021 17:30
Mathematics, 16.12.2021 17:30


History, 16.12.2021 17:30
Mathematics, 16.12.2021 17:30
Mathematics, 16.12.2021 17:30

Mathematics, 16.12.2021 17:30
Mathematics, 16.12.2021 17:30

Health, 16.12.2021 17:30


