 ----> equation A
 ----> equation B
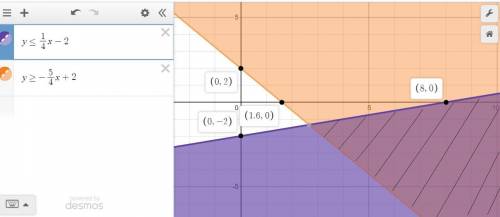
Which graph represents the solution set to the system of inequalities?
{y≤14x−2y≥−54x+2...

Mathematics, 17.12.2019 08:31 garasonmario
Which graph represents the solution set to the system of inequalities?
{y≤14x−2y≥−54x+2
coordinate graph showing a range of negative five and five on both axes. a solid line through begin ordered pair 0 comma 2 end ordered pair and begin ordered pair 4 comma negative 3 end ordered pair. another solid line through begin ordered pair 0 comma negative 2 end ordered pair and begin ordered pair 4 comma negative 1 end ordered pair. four regions are created by the intersection of the two lines. the right region is the shaded region.
coordinate graph showing a range of negative five and five on both x and y axes. a solid line through begin ordered pair 0 comma 2 end ordered pair and begin ordered pair 4 comma negative 3 end ordered pair. a dashed line through begin ordered pair 0 comma negative 2 end ordered pair and begin ordered pair 4 comma negative 1 end ordered pair. four regions are created by the intersection of the two lines. the upper right region is the shaded region.
coordinate graph showing a range from negative seven to three on both x and y axes. a solid line through begin ordered pair 0 comma 2 end ordered pair and begin ordered pair negative 4 comma negative 3 end ordered pair. a dashed line through begin ordered pair 0 comma negative 2 end ordered pair and begin ordered pair negative 4 comma negative 3 end ordered pair. four regions are created by the intersection of the two lines. the lower left region is the shaded region.
coordinate graph showing a range of negative five to five on both x and y axes. a solid line through begin ordered pair 0 comma 2 end ordered pair and begin ordered pair negative 4 comma negative 3 end ordered pair. a dashed line through begin ordered pair 0 comma negative 2 end ordered pair and begin ordered pair 4 comma negative 1 end ordered pair. four regions are created by the intersection of the two lines. the upper left region is the shaded region.

Answers: 3


Another question on Mathematics
Mathematics, 21.06.2019 14:00
News cameras take an overhead picture of a crowd at an outdoor event journalist then count the total number of people in the picture and use the sample of estimate the total number of people in the crowd this process is an example of
Answers: 1
Mathematics, 21.06.2019 21:30
Write an equation of the line that passes through the point (2, 3) and is perpendicular to the line x = -1. a) y = 1 b) y = 3 c) y = 0 eliminate d) y = -3
Answers: 2
Mathematics, 22.06.2019 00:30
1.3.25 question suppose 40​% of all voters voted for a particular candidate. to simulate exit polls regarding whether or not voters voted for this​ candidate, five random samples of size 1010 and five random samples of size 10001000 have been generated using technology using a population proportion of 0.400.40​, with the accompanying results. complete parts a through c below. click the icon to view the simulation results. a. observe how the sample proportions of successes vary around 0.400.40. simulation compared to sample prop simulation compared to sample prop 1 ▾ 6 ▾ greater than 0.40 less than 0.40 equal to 0.40 2 ▾ less than 0.40 greater than 0.40 equal to 0.40 7 ▾ greater than 0.40 less than 0.40 equal to 0.40 3 ▾ greater than 0.40 less than 0.40 equal to 0.40 8 ▾ equal to 0.40 greater than 0.40 less than 0.40 4 ▾ greater than 0.40 equal to 0.40 less than 0.40 9 ▾ less than 0.40 greater than 0.40 equal to 0.40 5 ▾ equal to 0.40 less than 0.40 greater than 0.40 10 ▾ equal to 0.40 greater than 0.40 less than 0.40 click to select your answer(s) and then click check answer. 2 parts remaining clear all check answer
Answers: 3
You know the right answer?
Questions


Biology, 16.04.2020 04:15

Mathematics, 16.04.2020 04:16


Social Studies, 16.04.2020 04:16
Mathematics, 16.04.2020 04:16

English, 16.04.2020 04:16
Mathematics, 16.04.2020 04:16


