
Mathematics, 18.12.2019 04:31 kitttimothy55
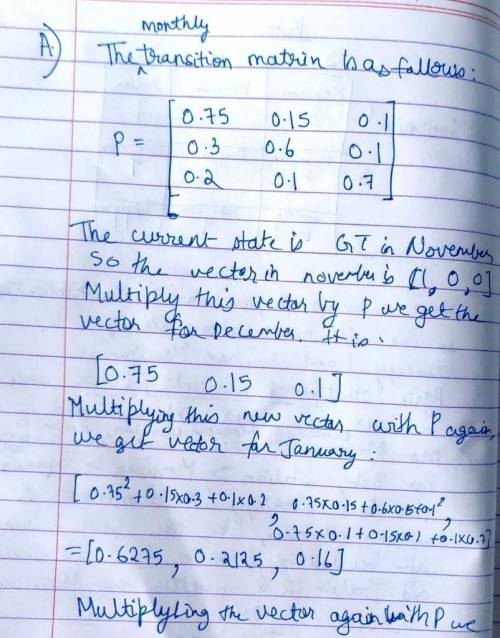
The gt brewery has hired you as an analyst to understand its market position. it is particularly concerned about its major competitor, the ml brewery, and which brewery has the ‘lead’ market share. recent history has suggested that which brewery has the ‘lead market share’ can be modeled as a markov chain using three states: gt, ml, and other company (oc). data on the lead market share is taken monthly and you have constructed the following one-step transition probability matrix from past data:
gt ml oc
gt 0.75 0.15 0.10
ml 0.30 0.60 0.10
oc 0.20 0.10 0.70
a. the current state of the lead market share in november is gt·the gt brewery is considering launching a new brand in march only if it has the lead market share in february. determine the probability that gt brewery will launch this new brand. show any equations or matrices used to calculate this probability and briefly explain how you obtained your answer.
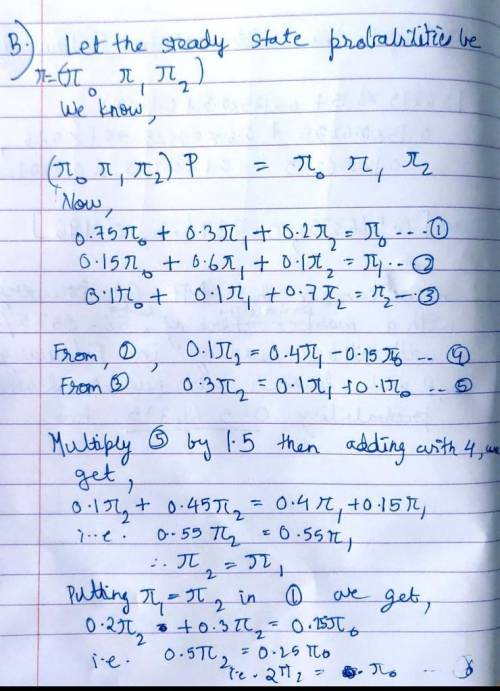
b. provide the steady-state equations and calculate the steady-state probabilities for the markov chain.

Answers: 2


Another question on Mathematics
Mathematics, 21.06.2019 13:30
Acity plans to build a new rectangular-shaped park. the perimeter of the park will be 940 meters. the width of the park will be 300 meters. what will be the length, in meters, of the new park?
Answers: 1
Mathematics, 21.06.2019 18:00
John read the first 114 pages of a novel, which was 3 pages less than 1/3 of the novel. write an equation to determine the total number of pages (p)(p) in the novel.
Answers: 1
Mathematics, 21.06.2019 18:40
Which compound inequality could be represented by the graph?
Answers: 1
Mathematics, 21.06.2019 20:30
Max recorded the heights of 500 male humans. he found that the heights were normally distributed around a mean of 177 centimeters. which statements about max’s data must be true? a) the median of max’s data is 250 b) more than half of the data points max recorded were 177 centimeters. c) a data point chosen at random is as likely to be above the mean as it is to be below the mean. d) every height within three standard deviations of the mean is equally likely to be chosen if a data point is selected at random.
Answers: 2
You know the right answer?
The gt brewery has hired you as an analyst to understand its market position. it is particularly con...
Questions
Mathematics, 31.10.2019 21:31


Biology, 31.10.2019 21:31

Geography, 31.10.2019 21:31

Mathematics, 31.10.2019 21:31

Mathematics, 31.10.2019 21:31
Geography, 31.10.2019 21:31

World Languages, 31.10.2019 21:31

Computers and Technology, 31.10.2019 21:31
Mathematics, 31.10.2019 21:31

Spanish, 31.10.2019 21:31
Mathematics, 31.10.2019 21:31


