
Mathematics, 18.12.2019 07:31 fowers7187
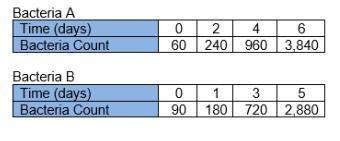
The tables show functions representing the growth of two types of bacteria on certain days within an experiment that lasted a total of 10 days.
how do the functions in the table compare?
since x-intercepts indicate the amount of each bacteria at the start of the experiment, there was more of bacteria b than bacteria a at the start.
since y-intercepts indicate the amount of each bacteria at the start of the experiment, there was more of bacteria b than bacteria a at the start.
since the maximum value in the table for bacteria a is greater than the maximum value in the table for bacteria b, bacteria a has a faster growth rate than bacteria b.
since the minimum value in the table for bacteria a is less than the minimum value in the table for bacteria b, bacteria a has a slower growth rate than bacteria b.

Answers: 1


Another question on Mathematics
Mathematics, 21.06.2019 15:30
What is the domain and range of each function 1. x (3, 5, 7, 8, 11) y ( 6, 7, 7, 9, 14) 2. x (-3, -1, 2, 5, 7) y (9, 5, 4, -5, -7)
Answers: 2
Mathematics, 21.06.2019 16:00
Julia is going for a walk through the neighborhood. what unit of measure is most appropriate to describe the distance she walks?
Answers: 1
Mathematics, 21.06.2019 17:30
Janet drove 300 miles in 4.5 hours. write an equation to find the rate at which she was traveling
Answers: 2
You know the right answer?
The tables show functions representing the growth of two types of bacteria on certain days within an...
Questions

Biology, 26.06.2020 18:01


Computers and Technology, 26.06.2020 18:01

English, 26.06.2020 18:01
Mathematics, 26.06.2020 18:01

Biology, 26.06.2020 18:01
Chemistry, 26.06.2020 18:01
Computers and Technology, 26.06.2020 18:01


