
Mathematics, 18.12.2019 17:31 Wanna14ever
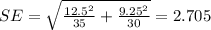
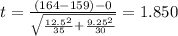
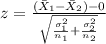
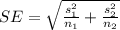
The following 5 questions are based on this information: an economist claims that average weekly food expenditure of households in city 1 is more than that of households in city 2. she surveys 35 households in city 1 and obtains an average weekly food expenditure of $164. a sample of 30 households in city 2 yields an average weekly expenditure of $159. historical data reveals that the population standard deviation for city 1 and city 2 are $12.50 and $9.25, respectively. col1 city 1 x1(bar)=164 σ(1)=12.5 n(1)=35col2 city 2 x2 (bar) =159 σ(2) =9.25 n2=30let μ(1) be the mean weekly food expenditure for city 1 and μ(2) be that for city 2.1. to test the economist’s claim, the competing hypotheses should be formulated asselect one: a. h0: μ1-μ2> 0 versus ha: μ1-μ2≤0b. h0: μ1-μ2≥0 versus ha: μ1-μ2< 02.the standard error of x(1)bar- x(2) bar isselect one: a. 0.82b. 2.70c. 12.5d. 9.253.the value of the test statistics isselect one: a. 0.40b. 1.85c. 0.54d. 27.784. the p-value of the test is
select one:
a. 0.34
b. 0.03
c. 0.29
d. 0.08
5.at α=0.05,
select one:
a. we can reject h(0) in favor of h(a)
b. we cannot reject h(0)
c. we can conclude that average weekly food expenditures in city 1 is less than that of city 2

Answers: 2


 represent the mean for the sample 1
 represent the mean for the sample 2
 represent the population standard deviation for the sample 1
 represent the population standard deviation for the sample B2
 sample size selected 1
 sample size selected 2
 represent the significance level for the hypothesis test.
 represent the p value for the test (variable of interest)
 (1)
(1)
 so we can conclude that we have enough evidence to reject the null hypothesis.

Another question on Mathematics
Mathematics, 21.06.2019 19:30
Asquare picture with sides of 32 inches is to be mounted on a square mat with sides of 52 inches. find the area of the mat that will remain uncovered by the picture.
Answers: 1
Mathematics, 21.06.2019 21:10
Lines b and c are parallel. what is the measure of 2? m2 = 31° m2 = 50° m2 = 120° m2 = 130°
Answers: 2
Mathematics, 22.06.2019 01:40
The graph below shows the line of best fit for data collected on the number of cell phones in cell phone cases sold at the local electronic store on four different days
Answers: 3
You know the right answer?
The following 5 questions are based on this information: an economist claims that average weekly fo...
Questions


Mathematics, 14.02.2020 22:50
Mathematics, 14.02.2020 22:51

Computers and Technology, 14.02.2020 22:51


