What type of association does the following scatter plot represent?
graph shows 0 to 10...

Mathematics, 19.12.2019 21:31 bo4isbad
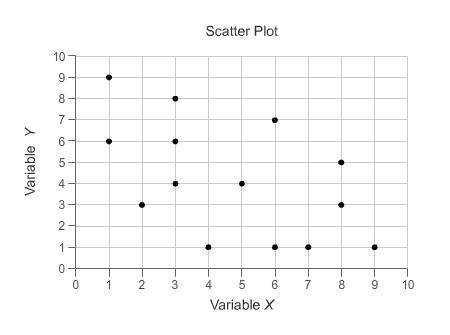
What type of association does the following scatter plot represent?
graph shows 0 to 10 on x and y axes at increments of 1. dots are made at the ordered pairs 0, 10 and 1, 9 and 2,8 and 3,7 and 4,6 and 5,5 and 6,4 and 7,3 and 8,2 and 9,1 and 10,0.
positive linear association
negative linear association
positive nonlinear association
negative nonlinear association

Answers: 2


Another question on Mathematics
Mathematics, 21.06.2019 19:00
Lucy is a dress maker. she sews \dfrac47 7 4 of a dress in \dfrac34 4 3 hour. lucy sews at a constant rate. at this rate, how many dresses does lucy sew in one hour? include fractions of dresses if applicable
Answers: 3
Mathematics, 21.06.2019 19:50
The probability that an adult possesses a credit card is .70. a researcher selects two adults at random. by assuming the independence, the probability that the first adult possesses a credit card and the second adult does not possess a credit card is:
Answers: 3
Mathematics, 21.06.2019 23:00
Jorge wants to determine the enlarged dimensions of a digital photo to be used as wallpaper on his computer screen. the original photo was 800 pixels wide by 600 pixels high. the new photo will be 1,260 pixels wide. what will the new height be?
Answers: 1
You know the right answer?
Questions

Mathematics, 27.06.2019 15:10

History, 27.06.2019 15:10
English, 27.06.2019 15:10


History, 27.06.2019 15:10
History, 27.06.2019 15:10


History, 27.06.2019 15:10

Chemistry, 27.06.2019 15:10


