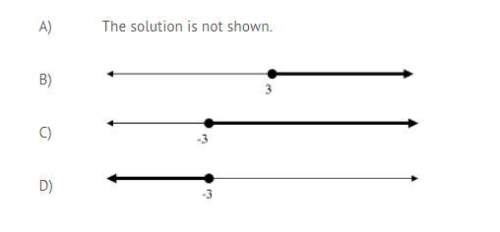
Choose the graph which represents the solution to the inequality:
-2x + 5 ≤ 11
...

Mathematics, 19.12.2019 22:31 tiwaribianca475
Choose the graph which represents the solution to the inequality:
-2x + 5 ≤ 11

Answers: 1


Another question on Mathematics
Mathematics, 21.06.2019 18:30
You receive 15% of the profit from a car wash how much money do you receive from a profit of 300
Answers: 2
Mathematics, 21.06.2019 18:40
Some boys and girls were asked if they had a pet. one third of the group were boys. there were 20 boys. 20% of the girls had a pet. boys with a pet : girls with a pet = 1 : 5 i need to know how many girls there are.
Answers: 3
Mathematics, 21.06.2019 19:30
Needmax recorded the heights of 500 male humans. he found that the heights were normally distributed around a mean of 177 centimeters. which statements about max’s data must be true? a) the median of max’s data is 250 b) more than half of the data points max recorded were 177 centimeters. c) a data point chosen at random is as likely to be above the mean as it is to be below the mean. d) every height within three standard deviations of the mean is equally likely to be chosen if a data point is selected at random.
Answers: 2
Mathematics, 21.06.2019 20:30
What is the length of the segment, endpoints of which are intersections of parabolas y=x2? 11 4 x? 7 4 and y=? 7 8 x2+x+ 31 8 ?
Answers: 2
You know the right answer?
Questions

Computers and Technology, 03.12.2021 04:10
Computers and Technology, 03.12.2021 04:10

Computers and Technology, 03.12.2021 04:10
Computers and Technology, 03.12.2021 04:10
SAT, 03.12.2021 04:10

Physics, 03.12.2021 04:10


Mathematics, 03.12.2021 04:10


Mathematics, 03.12.2021 04:10
Computers and Technology, 03.12.2021 04:10
Mathematics, 03.12.2021 04:10


