Need asap read it fully before answering because it is not multiple
1. a newspaper st...

Mathematics, 19.12.2019 23:31 carlshiabrown
Need asap read it fully before answering because it is not multiple
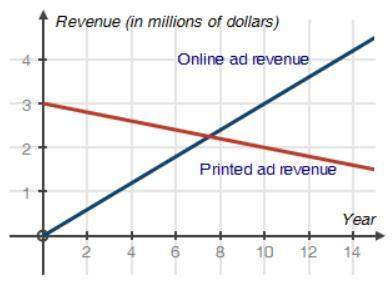
1. a newspaper started an online version of its paper 14 years ago. in a recent presentation to stockholders, the lead marketing executive states that the revenues for online ads have more than doubled that of the revenues for printed ads since starting the online version of the paper. a. use the graph below to justify the lead executive’s statement. b. determine the approximate year that the two ad revenues were equal. (( i will put a picture for the graph of the online ad question ))
2. two ocean beaches are being affected by erosion. the table shows the width, in feet, of each beach measured at high tide where 1995 is represented by year 0: year number western beach width (in feet) dunes beach width (in feet)
year | wb width (in feet) | db width (in feet)
0 | 100 | 20
5 | 90 | 45
10 | 80 | 70
11 | 78 | 75
12 | 76 | 80
15 | 70 | 95
a. describe the patterns shown by the erosion data measurements shown for each of the beaches in the table.
b. between which years will the beaches have approximately the same width?
c. assuming these rates remain constant, what can you do to get a better approximation of when the two beaches will have the same width?

Answers: 3


Another question on Mathematics
Mathematics, 21.06.2019 16:00
Asquare parking lot has 6,400 square meters what is the length in meters
Answers: 1
Mathematics, 21.06.2019 16:40
Which region represents the solution to the given system of inequalities? |-0.5x+y23 | 1.5x+ys-1 5 4 -3 -2 -1 1 2 3 4
Answers: 1
Mathematics, 21.06.2019 18:30
School has 204 sixth grade students. if the sixth grade is 30% of the total school, how many students are in the middle school?
Answers: 2
Mathematics, 21.06.2019 20:20
Consider the following estimates from the early 2010s of shares of income to each group. country poorest 40% next 30% richest 30% bolivia 10 25 65 chile 10 20 70 uruguay 20 30 50 1.) using the 4-point curved line drawing tool, plot the lorenz curve for bolivia. properly label your curve. 2.) using the 4-point curved line drawing tool, plot the lorenz curve for uruguay. properly label your curve.
Answers: 2
You know the right answer?
Questions


Chemistry, 21.07.2019 19:30

Biology, 21.07.2019 19:30

Mathematics, 21.07.2019 19:30
Mathematics, 21.07.2019 19:30

History, 21.07.2019 19:30
Mathematics, 21.07.2019 19:30
Mathematics, 21.07.2019 19:30


