
Mathematics, 02.01.2020 21:31 KittyLitty
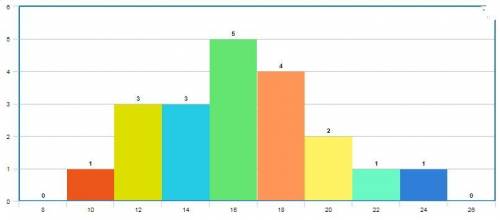
The dot plot represents an order of varying shirt sizes. a number line going from 8 to 26. 0 dots are above 8. 1 dot is above 10. 3 dots are above 12. 3 dots are above 14. 5 dots are above 16. 4 dots are above 18. 2 dots are above 20. 1 dot is above 22. 1 dot is above 24. 0 dots are above 26. which histogram represents the same data?

Answers: 3


Another question on Mathematics
Mathematics, 21.06.2019 19:00
Point r divides in the ratio 1 : 3. if the x-coordinate of r is -1 and the x-coordinate of p is -3, what is the x-coordinate of q? a. b. 3 c. 5 d. 6 e. -9
Answers: 1
Mathematics, 21.06.2019 20:30
Someone answer asap for ! a ball is rolled down a ramp. the height, f(x), in meters, of the ball x seconds after it is released is modeled by the function f(x) = x²- 10x + 25 for all values of x from 0 to 5. which statement about the ball is true? a. the maximum height of the ball is 5 meters b. the height of the ball increases from 0 to 5 meters above the ground. c. the ball has traveled 5 meters when it reaches the bottom of the ramp. d. the ball has been traveling for 5 seconds when it reaches the bottom of the ramp
Answers: 1
Mathematics, 21.06.2019 21:00
The perimeter of a rectangle is 42 inches. if the width of the rectangle is 6 inches, what is the length
Answers: 2
You know the right answer?
The dot plot represents an order of varying shirt sizes. a number line going from 8 to 26. 0 dots ar...
Questions


English, 01.07.2019 02:00
History, 01.07.2019 02:00
Mathematics, 01.07.2019 02:00
English, 01.07.2019 02:00


Business, 01.07.2019 02:00
History, 01.07.2019 02:00


