Mathematics, 03.01.2020 03:31 Haleysaraya1
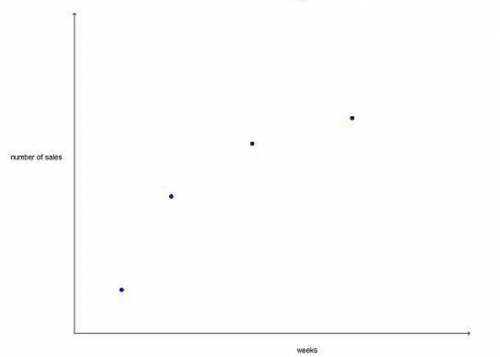
School yearbooks were printed, and the table shows the number of people who bought them the ferst, second, thrid, and fourth weeks after their release. which graph could represent the data shown in the table?

Answers: 1


Another question on Mathematics

Mathematics, 21.06.2019 17:30
The sales totals at macy's food store have increased exponentially over the months. which of these best shows the sales in the first three months?
Answers: 2


Mathematics, 21.06.2019 18:10
Drag the tiles to the boxes to form correct pairs. not all tiles will be used. match each set of vertices with the type of quadrilateral they form.
Answers: 1

Mathematics, 21.06.2019 21:00
Tim open up a new saving account with a $50 deposit and plant to deposit $20 per week into the same account.write an expression to represent the total amount in his savings account.
Answers: 1
You know the right answer?
School yearbooks were printed, and the table shows the number of people who bought them the ferst, s...
Questions


Mathematics, 31.01.2021 01:00

Mathematics, 31.01.2021 01:00

Mathematics, 31.01.2021 01:00


Mathematics, 31.01.2021 01:00

Mathematics, 31.01.2021 01:00


Mathematics, 31.01.2021 01:00

Advanced Placement (AP), 31.01.2021 01:00


Mathematics, 31.01.2021 01:00


Mathematics, 31.01.2021 01:00


