
Mathematics, 11.01.2020 03:31 daphnewibranowsky
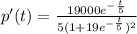
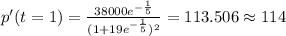
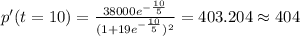
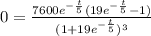
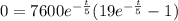
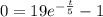
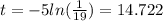
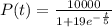
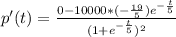
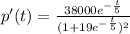
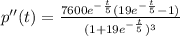
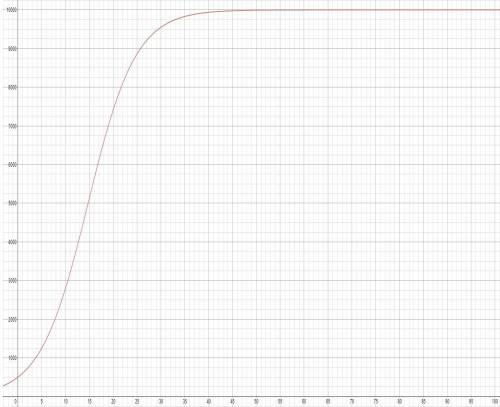
Population growth a lake is stocked with 500 fish, and their population increases according to the logistic curve where t is measured in months. use a graphing utility to graph the function. what is the limiting size of the fish population? at what rates is the fish population changing at the end of 1 month and at the end of 10 months? after how many months is the population increasing most rapidly?

Answers: 1


Another question on Mathematics
Mathematics, 21.06.2019 16:10
The box plot shows the number of raisins found in sample boxes from brand c and from brand d. each box weighs the same. what could you infer by comparing the range of the data for each brand? a) a box of raisins from either brand has about 28 raisins. b) the number of raisins in boxes from brand c varies more than boxes from brand d. c) the number of raisins in boxes from brand d varies more than boxes from brand c. d) the number of raisins in boxes from either brand varies about the same.
Answers: 2
Mathematics, 21.06.2019 16:30
Quadrilateral ghjk has vertices g(2, 3), h(8, 2), j(6, 8), and k(3, 6). it is transformed according to the rule t(–4, –5). what are the coordinates of g”? (–7, 3) (–2, 2) (–1, –7) (2, –2)
Answers: 2
Mathematics, 22.06.2019 00:00
Macy spent $36 on jeans. this was $12 less than twice what she spent on a shirt. which equation to solve this, 12x=36 2x=36-12 2x-12=36 12-2x=36
Answers: 1
Mathematics, 22.06.2019 01:00
Find the unit rate. enter your answer as a mixed number. a fertilizer covers 2/3 square foot in 1/2 hour.
Answers: 2
You know the right answer?
Population growth a lake is stocked with 500 fish, and their population increases according to the l...
Questions

English, 17.02.2020 06:25

Social Studies, 17.02.2020 06:25
English, 17.02.2020 06:25


Spanish, 17.02.2020 06:25
Mathematics, 17.02.2020 06:25
Mathematics, 17.02.2020 06:26

Spanish, 17.02.2020 06:26
English, 17.02.2020 06:27
Mathematics, 17.02.2020 06:27
Mathematics, 17.02.2020 06:27

Chemistry, 17.02.2020 06:27
English, 17.02.2020 06:27


