
Mathematics, 16.01.2020 18:31 connor3434
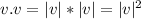
The dot product can be used to determine the square of the magnitude of a vector v. which of the following expressions represents the square of the magnitude of a vector? a. v/|v|b. v.|v|c. v. vd. v^2.v^2

Answers: 3
 and
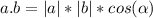
and  are the magnitudes of the vectors a and b
 is the angle between vectors a and b


Another question on Mathematics
Mathematics, 21.06.2019 13:40
Questions 14 through 23, choose the onest answer. write your answer in the box forestion 24. mark your answer on the coordinatene grid for question 25.the sum of three consecutive even numbers is 96.what is the largest of these numbers? (a) 30(b) 32(c) 34(d) 36
Answers: 2
Mathematics, 21.06.2019 17:00
In tossing one coin 10 times, what are your chances for tossing a head? a tail? 2. in tossing one coin 100 times, what are your chances for tossing a head? a tail? 3. in tossing one coin 200 times, what are your chances for tossing a head? a tail? deviation = ((absolute value of the difference between expected heads and observed heads) + (absolute value of the difference between expected tails and observed tails)) divided by total number of tosses. this value should always be positive. 4. what is the deviation for 10 tosses? 5. what is the deviation for the 100 tosses? 6. what is the deviation for 200 tosses? 7. how does increasing the total number of coin tosses from 10 to 100 affect the deviation? 8. how does increasing the total number of tosses from 100 to 200 affect the deviation? 9. what two important probability principles were established in this exercise? 10. the percent of occurrence is the obtained results divided by the total tosses and multiplied by 100%. toss the coins 100 times and record your results. calculate the percent occurrence for each combination. percent head-head occurrence: percent tail-tail occurrence: percent head-tail occurrence:
Answers: 3
Mathematics, 22.06.2019 01:20
1. why is a frequency distribution useful? it allows researchers to see the "shape" of the data. it tells researchers how often the mean occurs in a set of data. it can visually identify the mean. it ignores outliers. 2. the is defined by its mean and standard deviation alone. normal distribution frequency distribution median distribution marginal distribution 3. approximately % of the data in a given sample falls within three standard deviations of the mean if it is normally distributed. 95 68 34 99 4. a data set is said to be if the mean of the data is greater than the median of the data. normally distributed frequency distributed right-skewed left-skewed
Answers: 2
You know the right answer?
The dot product can be used to determine the square of the magnitude of a vector v. which of the fol...
Questions


History, 28.04.2021 01:00
Biology, 28.04.2021 01:00
Mathematics, 28.04.2021 01:00

Spanish, 28.04.2021 01:00

Health, 28.04.2021 01:00
Mathematics, 28.04.2021 01:00


Chemistry, 28.04.2021 01:00
Mathematics, 28.04.2021 01:00
Mathematics, 28.04.2021 01:00
Mathematics, 28.04.2021 01:00
Mathematics, 28.04.2021 01:00


