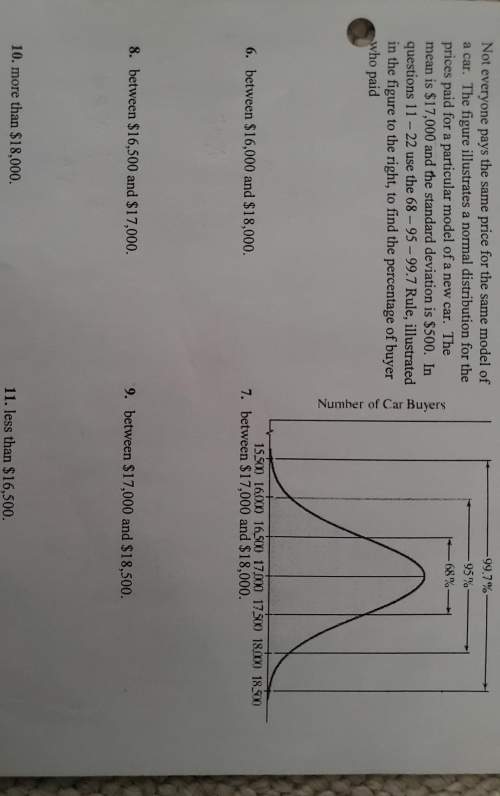
Not everyone pays the same price for the same model of
a car. the figure illustrates a normal d...

Mathematics, 17.01.2020 02:31 ellaemtagedeane
Not everyone pays the same price for the same model of
a car. the figure illustrates a normal distribution for the
prices paid for a particular model of a new car. the
mean is $17,000 and the standard deviation is $500. in
questions 11 - 22 use the 68 - 95 - 99.7 rule, illustrated
in the figure to the right to find the percentage of buyer
who paid
number of car buyers
6. between $16,000 and $18,000.
7. between $17,000 and $18,000.
8. between $16,500 and $17,000.
9. between $17,000 and $18,500.
10. more than $18,000.
11. less than $16,500.


Answers: 1


Another question on Mathematics

Mathematics, 21.06.2019 16:00
Use set buikder notation to represent the following set: {, -2, -1, 0}
Answers: 1


Mathematics, 22.06.2019 00:20
Convert the number to decimal form. 12) 312five a) 82 b) 30 c) 410 d) 1560 13) 156eight a) 880 b) 96 c) 164 d) 110 14) 6715eight a) 53,720 b) 3533 c) 117 d) 152
Answers: 1

Mathematics, 22.06.2019 01:00
Suppose m: angle a =77 degrees what is the measure of a complement of a complement of angle a, what is a conclusion you can draw about a complement of a complement of an angle
Answers: 1
You know the right answer?
Questions

Mathematics, 01.09.2019 10:30

Chemistry, 01.09.2019 10:30


German, 01.09.2019 10:30

History, 01.09.2019 10:30

Mathematics, 01.09.2019 10:30

History, 01.09.2019 10:30

Social Studies, 01.09.2019 10:30

History, 01.09.2019 10:30

Social Studies, 01.09.2019 10:30


