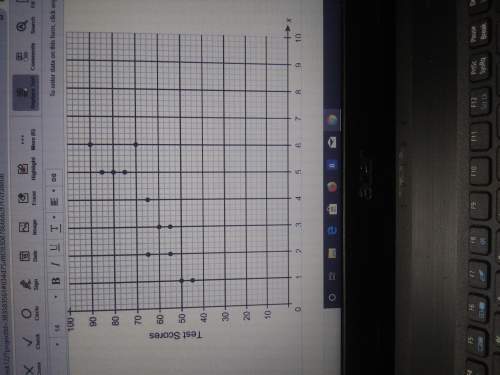
Consider this scatter plot.
(a) how would you characterize the relationship between the...

Mathematics, 18.01.2020 02:31 Woodlandgirl14
Consider this scatter plot.
(a) how would you characterize the relationship between the hours spent on homework and the test
scores? explain.
(b) paul uses the function y = 8x + 42 to model the situation. what score does the model predict for 3 h
of homework?

Answers: 3


Another question on Mathematics
Mathematics, 21.06.2019 16:40
You have 3 boxes, one "strawberries"; one "mentos" and one "mixed".but you know that all the labels are in incorrect order .how do you know witch is witch?
Answers: 1
Mathematics, 21.06.2019 20:30
Solve each quadratic equation by factoring and using the zero product property. n^2 - 49 = 0
Answers: 2
Mathematics, 21.06.2019 22:00
Given the quadratic function f(x)=3x^2-24x+49 a. use “completing the squares” to convert the quadratic function into vertex form b. state the vertex c. find the x and y intercepts d. graph the function
Answers: 1
Mathematics, 21.06.2019 23:30
Ahighway between points a and b has been closed for repairs. an alternative route between there two locations is to travel between a and c and then from c to b what is the value of y and what is the total distance from a to c to b?
Answers: 1
You know the right answer?
Questions


Mathematics, 28.04.2021 18:00
Mathematics, 28.04.2021 18:00

Mathematics, 28.04.2021 18:00


Chemistry, 28.04.2021 18:00
Engineering, 28.04.2021 18:00
Mathematics, 28.04.2021 18:00

Physics, 28.04.2021 18:00


