
Mathematics, 19.01.2020 03:31 LaneyMM1401
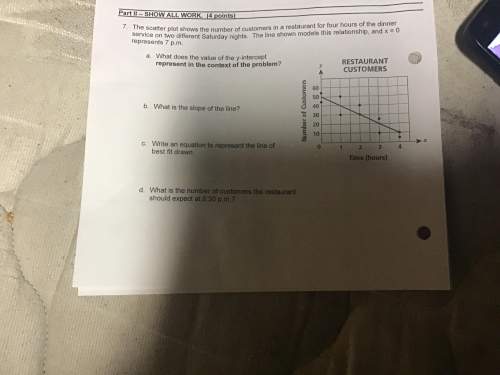
The scatter plot shows the number of customers in a restaurant for hours of the dinner services on two different saturday nights. the line shown models this relationship, and x=0 represent 7: 00pm
a. what does the value y-intercept represent in the context of the problem (shown inherent attachment)
b. what is the slope of the line?
c. write an equation to represent the line of nest fit drawn
d. wat is the number of customers the restaurant should expect at 8: 30pm?

Answers: 1

 .
. .
.


Another question on Mathematics
Mathematics, 21.06.2019 16:30
In two or more complete sentences describe how to determine the appropriate model for the set of data, (1,1), (3,2), (6,3), (11,4).
Answers: 1
Mathematics, 21.06.2019 18:30
How to use order of operation in 20 divide by 4 multiply 5 = 1
Answers: 1
Mathematics, 21.06.2019 19:00
Astore has apples on sale for three dollars or 2 pounds how many pounds of apples can you buy for nine dollars if an apple is approximately 5 ounces how many apples can you buy for nine dollars
Answers: 1
Mathematics, 22.06.2019 04:30
An archaeologist in turkey discovers a spear head that contains 53% of its original amount of c-14. find the age of the spear head to the nearest year. (5250 isn’t right)
Answers: 1
You know the right answer?
The scatter plot shows the number of customers in a restaurant for hours of the dinner services on t...
Questions


Biology, 23.02.2021 20:40
Mathematics, 23.02.2021 20:40
Mathematics, 23.02.2021 20:40

English, 23.02.2021 20:40
Mathematics, 23.02.2021 20:40
Mathematics, 23.02.2021 20:40

Arts, 23.02.2021 20:40
Biology, 23.02.2021 20:40
Mathematics, 23.02.2021 20:40
Social Studies, 23.02.2021 20:40

History, 23.02.2021 20:40
Mathematics, 23.02.2021 20:40
English, 23.02.2021 20:40
Biology, 23.02.2021 20:40
Mathematics, 23.02.2021 20:40


