
Mathematics, 21.01.2020 19:31 KF16
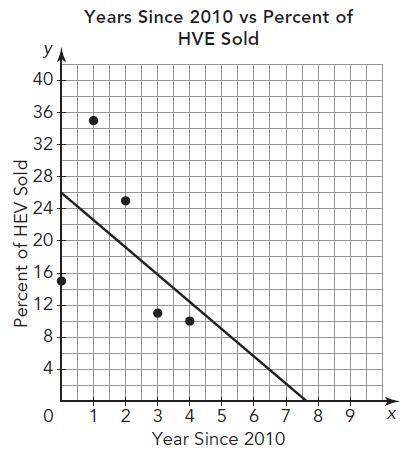
The jayc dealership tracks its car sales based on the type of car. the graph shows the percent of sales that were hybrid electric vehicles (hev) for the years (2010–2015).
explain what year is represented by an x-value of 3 on the graph.
write the equation of the line of best fit in the graph. define your variables and include the units.
what does the slope of the line represent in this problem situation?

Answers: 1


Another question on Mathematics
Mathematics, 21.06.2019 16:50
Which of the following points is collinear with (-2,1) and (0,3)
Answers: 3
Mathematics, 21.06.2019 18:20
What is the solution set of the quadratic inequality x2- 5< 0? o {xl-55x55{x- 155x55){xl -55x5 15){x1 - 15 sx5/5)
Answers: 2
Mathematics, 21.06.2019 19:30
Ineed with angles and the measure of them i have abc a is 65 and b is (3x-10) and c is (2x) find the value of x
Answers: 2
You know the right answer?
The jayc dealership tracks its car sales based on the type of car. the graph shows the percent of sa...
Questions

English, 06.10.2019 23:00
Mathematics, 06.10.2019 23:00
Mathematics, 06.10.2019 23:00


English, 06.10.2019 23:00
Mathematics, 06.10.2019 23:00

World Languages, 06.10.2019 23:00

Chemistry, 06.10.2019 23:00
Mathematics, 06.10.2019 23:00
Mathematics, 06.10.2019 23:00
History, 06.10.2019 23:00
History, 06.10.2019 23:00

Biology, 06.10.2019 23:00


