
Mathematics, 22.01.2020 02:31 Ree0628
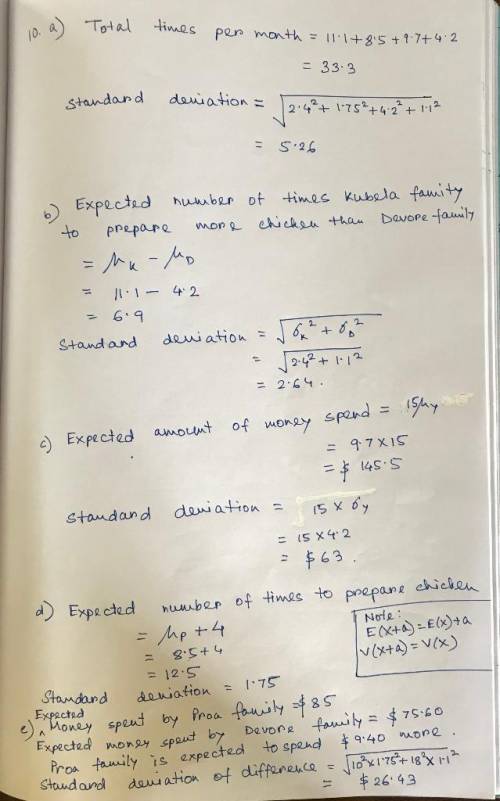
The following are the expected values and standard deviations for the number of times per month that the families prepare chicken for dinner. kubelka family: u = 11.1 times a month, o = 2.4 times proa family: u = 8.5 times a month, o = 1.75 times ye family: u = 9.7 times a month, o = 4.2 times devore family: u = 4.2 times a month, o = 1.1 times
a. how many total times per month do the families prepare chicken? standard deviation?
b. how many more times a month would you expect the kubelka family to prepare chicken than the devore family? standard deviation?
c. if the ye family typically spends $15 on ingredients each time they prepare chicken, how much money would you expect them to spend each month on their chicken dinners? standard deviation?
d. the proa family has decided to try to replace one meal a week that they typically ate pork with a chicken dish. how many times per month would we expect the proa family to prepare chicken now? standard deviation?
e. the proa family typically spends $10 on ingredients each time they prepare chicken while the devore family typically spends $18 on ingredients each time they prepare chicken. which family would you expect to spend the most each month? how much more? standard deviation?

Answers: 1


Another question on Mathematics
Mathematics, 21.06.2019 23:30
Drag each number to the correct location on the statements. not all numbers will be used. consider the sequence below. -34, -21, -8, 5, complete the recursively defined function to describe this sequence
Answers: 1
Mathematics, 22.06.2019 00:30
Julie multiplies 6.27 by 7 and claims the product is 438.9 .explain without multiplying how you know juliesanswer is not correct.find the correct answer
Answers: 1
Mathematics, 22.06.2019 01:20
1. why is a frequency distribution useful? it allows researchers to see the "shape" of the data. it tells researchers how often the mean occurs in a set of data. it can visually identify the mean. it ignores outliers. 2. the is defined by its mean and standard deviation alone. normal distribution frequency distribution median distribution marginal distribution 3. approximately % of the data in a given sample falls within three standard deviations of the mean if it is normally distributed. 95 68 34 99 4. a data set is said to be if the mean of the data is greater than the median of the data. normally distributed frequency distributed right-skewed left-skewed
Answers: 2
You know the right answer?
The following are the expected values and standard deviations for the number of times per month that...
Questions

Mathematics, 17.12.2020 17:30


Mathematics, 17.12.2020 17:30

English, 17.12.2020 17:30
English, 17.12.2020 17:30


History, 17.12.2020 17:30
Chemistry, 17.12.2020 17:30
English, 17.12.2020 17:30
Mathematics, 17.12.2020 17:30
History, 17.12.2020 17:30


