
20 points for real answer
the data on the graph show the foot lengths and forearm lengths for...

Mathematics, 22.01.2020 19:31 freespm57
20 points for real answer
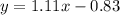
the data on the graph show the foot lengths and forearm lengths for a group of people. the line of best fit for the data is shown. use the equation of the line of best fit to predict the length of a person’s forearm if the length of their foot is 8 inches.
a graph is labeled as foot length versus forearm length. the horizontal axis is labeled as length of foot left parenthesis inches right parenthesis and the vertical axis is labeled as length of forearm left parenthesis inches right parenthesis. the values on the horizontal axis range from 0 to 15 in increments of 1 and the values on the vertical axis range from 0 to 15 in increments of 1. several points are scattered throughout the graph and a line is shown which passes between these points and the equation of the line is labeled as y equals 1 decimal point 1 1 x minus 0 decimal point 8 3.
a.
8.88 inches
b.
6.94 inches
c.
9.16 inches
d.
8.05 inches

Answers: 1


Another question on Mathematics
Mathematics, 21.06.2019 22:50
Listed below are time intervals (min) between eruptions of a geyser. assume that the "recent" times are within the past few years, the "past" times are from around 20 years ago, and that the two samples are independent simple random samples selected from normally distributed populations. do not assume that the population standard deviations are equal. does it appear that the mean time interval has changed? is the conclusion affected by whether the significance level is 0.10 or 0.01? recent 78 90 90 79 57 101 62 87 71 87 81 84 57 80 74 103 62 past 88 89 93 94 65 85 85 92 87 91 89 91 follow the steps of hypothesis testing, including identifying the alternative and null hypothesis, calculating the test statistic, finding the p-value, and making a conclusions about the null hypothesis and a final conclusion that addresses the original claim. use a significance level of 0.10. is the conclusion affected by whether the significance level is 0.10 or 0.01? answer choices below: a) yes, the conclusion is affected by the significance level because h0 is rejected when the significance level is 0.01 but is not rejected when the significance level is 0.10. b) no, the conclusion is not affected by the significance level because h0 is not rejected regardless of whether a significance level of 0.10 or 0.01 is used. c) yes, the conclusion is affected by the significance level because h0 is rejected when the significance level is 0.10 but is not rejected when the significance level is 0.01. d) no, the conclusion is not affected by the significance level because h0 is rejected regardless of whether a significance level of 0.10 or 0.01 is used.
Answers: 3
Mathematics, 22.06.2019 02:30
Amotorboat maintained a constant speed of 12 miles per hour relative to the water in going 45 miles upstream and then returning. the total time for the trip was 8.0 hours. use this information to find the speed of the current.
Answers: 1
Mathematics, 22.06.2019 04:00
Which statements are true about the linear equation y> 3/4x-2? check all that apply
Answers: 2
Mathematics, 22.06.2019 06:00
What is the slope of a line that is perpendicular to the line shown on the graph? –4 4
Answers: 3
You know the right answer?
Questions
Mathematics, 19.12.2019 06:31

Biology, 19.12.2019 06:31

Social Studies, 19.12.2019 06:31
Mathematics, 19.12.2019 06:31

History, 19.12.2019 06:31
Mathematics, 19.12.2019 06:31
Mathematics, 19.12.2019 07:31
Biology, 19.12.2019 07:31
Mathematics, 19.12.2019 07:31

Physics, 19.12.2019 07:31
Biology, 19.12.2019 07:31
Mathematics, 19.12.2019 07:31
Mathematics, 19.12.2019 07:31

English, 19.12.2019 07:31


