
Mathematics, 22.01.2020 20:31 4presidents
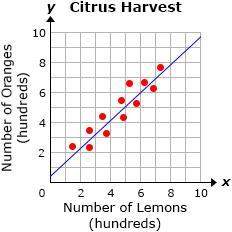
The scatter plot shows the number of oranges picked, in hundreds, in relation to the number of lemons harvested, in hundreds, by several farmers.
according to the plot, which value is the best estimate of the correlation coefficient of the data?
a.
-0.2
b.
-0.9
c.
0.9
d.
0.2
plato

Answers: 2


Another question on Mathematics
Mathematics, 21.06.2019 17:30
Simplify this expression.2(10) + 2(x – 4) a. 2x + 16 b. x + 12 c. 2x + 12 d. x + 16
Answers: 2
Mathematics, 21.06.2019 21:00
Yahir designs bracelets. he uses between 9 and 15 red and yellow beads in the ratio of 2 red bead to 5 yellow beads. drag the beads into the container to meet these requirements
Answers: 2
Mathematics, 21.06.2019 21:30
Using the information in the customer order, determine the length and width of the garden. enter the dimensions. length: feet width: feet
Answers: 3
You know the right answer?
The scatter plot shows the number of oranges picked, in hundreds, in relation to the number of lemon...
Questions

Health, 02.10.2019 09:50

Biology, 02.10.2019 09:50

Social Studies, 02.10.2019 09:50

History, 02.10.2019 09:50

Arts, 02.10.2019 09:50
Mathematics, 02.10.2019 09:50
Mathematics, 02.10.2019 09:50

Geography, 02.10.2019 09:50

Computers and Technology, 02.10.2019 09:50
Mathematics, 02.10.2019 09:50
Geography, 02.10.2019 09:50
Geography, 02.10.2019 09:50
History, 02.10.2019 09:50


