
Mathematics, 23.01.2020 18:31 Govind3793
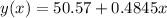
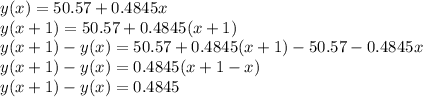
Asimple linear regression analysis was conducted to predict the exam 3 score of students in sta 2023 based on their exam 1 score. the analysis yielded the following results:
y-^ = 50.57+0.4845x.
1. which of the following is the best description of the slope of the line?
group of answer choices:
o as the exam1 score increases by 1 point, the student's exam 3 grade will increase, on average, by 0.4845 points.
o as the exam 1 score increases by 1 point, the student's exam 3 grade will increase, on average, by 50.57 points.
o as the exam 3 score increases by 1 point, the student's exam 1 score will increase, on average by 0.4845 points.
o as the exam 3 score increases by 1 point, the student's exam 1 score will increase, on average by 50.57 points.

Answers: 1


Another question on Mathematics
Mathematics, 21.06.2019 17:30
If the measure of angle 1 is 110 degrees and the measure of angle 3 is (2 x+10 degree), what is the value of x?
Answers: 2
You know the right answer?
Asimple linear regression analysis was conducted to predict the exam 3 score of students in sta 2023...
Questions

English, 28.07.2019 04:34

Physics, 28.07.2019 04:34

History, 28.07.2019 04:34
History, 28.07.2019 04:34
History, 28.07.2019 04:34

Spanish, 28.07.2019 04:34
Mathematics, 28.07.2019 04:34
Mathematics, 28.07.2019 04:34

Social Studies, 28.07.2019 04:34
Mathematics, 28.07.2019 04:34
Mathematics, 28.07.2019 04:34
Mathematics, 28.07.2019 04:34
Mathematics, 28.07.2019 04:34
Social Studies, 28.07.2019 04:34


