Mathematics, 26.01.2020 02:31 YeshaKira
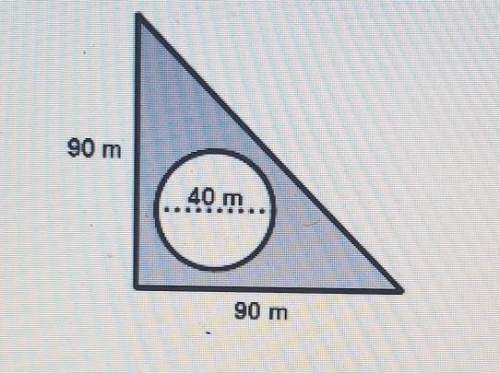
Find the approximate area of the shaded region below, consisting of a right triangle with a circle cut out of it. use 3.14 as an approximation for pi.


Answers: 1


Another question on Mathematics

Mathematics, 21.06.2019 17:00
Me on this one i will give you 20pts. answer should be in detail . this is the discussion topic. one of the most fiercely debated topics in sports is the hot hand theory. the hot hand theory says that success breeds success. in other words, rather than each shot a basketball player takes or each at-bat a baseball player has being an independent event, the outcome of one event affects the next event. that is, a player can get hot and make a lot of shots in a row or get a lot of hits in a row. the hot hand theory, however, has been shown to be false in numerous academic studies. read this article, which discusses the hot hand theory as it relates to a professional basketball player. state whether you agree or disagree with the hot hand theory, and give reasons for your opinion. be sure to use some of the terms you’ve learned in this unit, such as independent event, dependent event, and conditional probability, in your answer.
Answers: 2

Mathematics, 21.06.2019 20:30
Daryl factors the polynomial p(x)=x3+x2−26x+24 to rewrite it as p(x)=(x+6)(x−4)(x−1). which equations must be true? there may be more than one correct answer. select all correct answers. p(1)=0 p(−4)=0 p(−1)=0 p(6)=0 p(4)=0 p(−6)=0
Answers: 1

Mathematics, 21.06.2019 21:30
The price of a dozen eggs was $1.63. suppose the price increases m dollars per dozen and then the price decreases $0.12 per dozen. which expression represents the current price of eggs after the two price changes?
Answers: 1

Mathematics, 22.06.2019 01:00
The weight of 46 new patients of a clinic from the year 2018 are recorded and listed below. construct a frequency distribution, using 7 classes. then, draw a histogram, a frequency polygon, and an ogive for the data, using the relative information from the frequency table for each of the graphs. describe the shape of the histogram. data set: 130 192 145 97 100 122 210 132 107 95 210 128 193 208 118 196 130 178 187 240 90 126 98 194 115 212 110 225 187 133 220 218 110 104 201 120 183 124 261 270 108 160 203 210 191 180 1) complete the frequency distribution table below (add as many rows as needed): - class limits - class boundaries - midpoint - frequency - cumulative frequency 2) histogram 3) frequency polygon 4) ogive
Answers: 1
You know the right answer?
Find the approximate area of the shaded region below, consisting of a right triangle with a circle c...
Questions


Physics, 25.04.2021 14:00

Mathematics, 25.04.2021 14:00

Business, 25.04.2021 14:00

Mathematics, 25.04.2021 14:00

Physics, 25.04.2021 14:00

Mathematics, 25.04.2021 14:00

Mathematics, 25.04.2021 14:00

Chemistry, 25.04.2021 14:00

Mathematics, 25.04.2021 14:00


Mathematics, 25.04.2021 14:00

Mathematics, 25.04.2021 14:00


Chemistry, 25.04.2021 14:00

Mathematics, 25.04.2021 14:00


Mathematics, 25.04.2021 14:00

Biology, 25.04.2021 14:00


