
Mathematics, 27.01.2020 12:31 sloane50
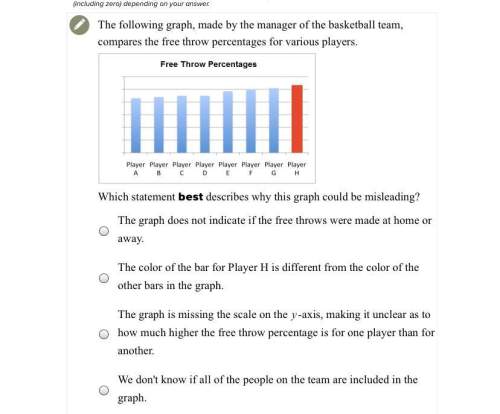
The following graph, made by the manager of the basketball team, compares the free throw percentages for various players.
which statement best describes why this graph could be misleading?
a. the graph does not indicate if the free throws were made at home or away.
b. the color of the bar for player h is different from the color of the other bars in the graph.
c. the graph is missing the scale on the y-axis, making it unclear as to how much higher the free throw percentage is for one player than for another.
d. we don't know if all of the people on the team are included in the graph.

Answers: 3


Another question on Mathematics
Mathematics, 21.06.2019 18:00
Me asap! what is the slope of this line? enter your answer in the box.
Answers: 2
Mathematics, 21.06.2019 18:30
Acoin bank containing only dimes and quarters has 12 more dimes than quarters. the total value of the coins is $11. how many quarters and dimes are in the coin bank?
Answers: 1
Mathematics, 21.06.2019 19:00
What is the expression in factored form? -x^2 + 3x + 28 a. (x-7)(x-4) b. -(x-7)(x+4) c. (x+4)(x+7) d. -(x-4)(x+7)
Answers: 2
You know the right answer?
The following graph, made by the manager of the basketball team, compares the free throw percentages...
Questions

Mathematics, 11.07.2019 01:00


Mathematics, 11.07.2019 01:00
Mathematics, 11.07.2019 01:00

Computers and Technology, 11.07.2019 01:00
Mathematics, 11.07.2019 01:00

Biology, 11.07.2019 01:00
Mathematics, 11.07.2019 01:00
Physics, 11.07.2019 01:00

Social Studies, 11.07.2019 01:00


