
Mathematics, 27.01.2020 12:31 MsTasha06
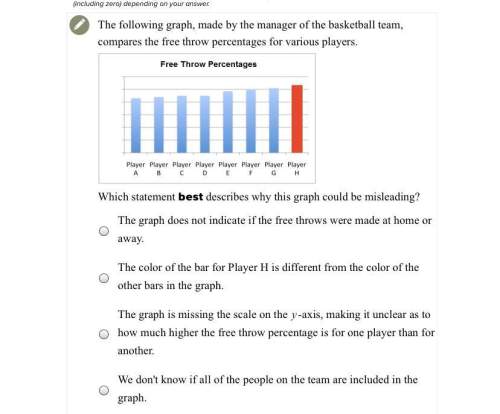
The following graph, made by the manager of the basketball team, compares the free throw percentages for various players.
which statement best describes why this graph could be misleading?
a. the graph does not indicate if the free throws were made at home or away.
b. the color of the bar for player h is different from the color of the other bars in the graph.
c. the graph is missing the scale on the y-axis, making it unclear as to how much higher the free throw percentage is for one player than for another.
d. we don't know if all of the people on the team are included in the graph.

Answers: 1


Another question on Mathematics
Mathematics, 21.06.2019 15:00
Sienna planned a trapezoid-shaped garden, as shown in the drawing below. she decides to change the length of the top of the trapezoid-shaped garden from 32 ft to 24 ft. which expression finds the change in the scale factor?
Answers: 1
Mathematics, 21.06.2019 18:50
What are the values of a, b, and c in the quadratic equation 0 = x2 – 3x - 2? a = 1, b = 3, c = 2 a=, b = -3,c=-2 a = 1, b = 3, c= 2 a = 1.0= -3, c = 2
Answers: 2
Mathematics, 21.06.2019 22:00
If you have 12 feet of string and you cut it into equal length of 5 inches each how much string will be left
Answers: 2
Mathematics, 22.06.2019 01:00
The collection of beautiful oil paintings currently on display at an art gallery well defined; set not well defined; not a set
Answers: 2
You know the right answer?
The following graph, made by the manager of the basketball team, compares the free throw percentages...
Questions

Mathematics, 13.12.2019 19:31


