PLEASE I NEED THIS NOW! *I will mark brainliest*
The scatter plot shows the number of pu...

Mathematics, 10.02.2020 23:52 brianrodriguez2005
PLEASE I NEED THIS NOW! *I will mark brainliest*
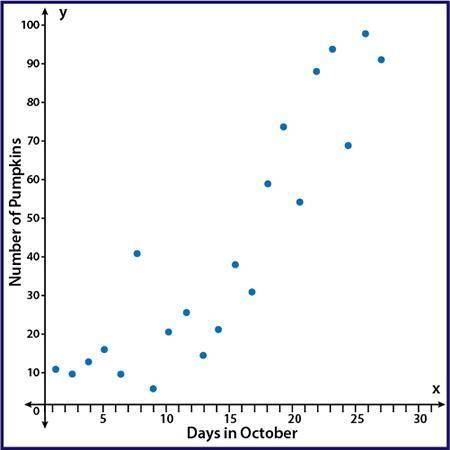
The scatter plot shows the number of pumpkins that have been picked on the farm during the month of October: A scatter plot with points showing an upward trend with points that are moderately spread out from a line of best fit. The y axis is labeled Number of Pumpkins and the x axis is labeled Days in October
Part A: Using computer software, a correlation coefficient of r = 0.51 was calculated. Based on the scatter plot, is that an accurate value for this data? Why or why not? (5 points)
Part B: Instead of comparing the number of pumpkins picked and the day in October, write a scenario that would be a causal relationship for pumpkins picked on the farm. (5 points)

Answers: 1


Another question on Mathematics
Mathematics, 21.06.2019 19:30
Hardest math question of all time can you solve the equation. check for extraneous solutions.9∣9-8x∣ = 2x+3
Answers: 2
Mathematics, 21.06.2019 23:00
If 3 3/4 lb. of candy costs 20.25 how much would 1lb. of candy cost
Answers: 1
Mathematics, 21.06.2019 23:30
I'm a polygon i have no parallel lines i am formed 3 line segments i have one right angle two of my angles are angles what am i
Answers: 1
You know the right answer?
Questions

Social Studies, 24.11.2020 19:10
Mathematics, 24.11.2020 19:10
Mathematics, 24.11.2020 19:10

Mathematics, 24.11.2020 19:10

Computers and Technology, 24.11.2020 19:10

History, 24.11.2020 19:10
Mathematics, 24.11.2020 19:10

Chemistry, 24.11.2020 19:10
Mathematics, 24.11.2020 19:10


