YOU DO NOT UNDERSTAND HOW MANY TIMES I HAVE POSTED THIS
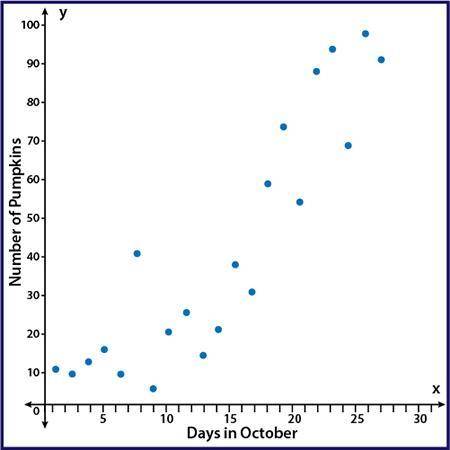
The scatter plot shows the number of p...

Mathematics, 11.02.2020 00:35 madisonsolis05
YOU DO NOT UNDERSTAND HOW MANY TIMES I HAVE POSTED THIS
The scatter plot shows the number of pumpkins that have been picked on the farm during the month of October:
A scatter plot with points showing an upward trend with points that are moderately spread out from a line of best fit. The y axis is labeled Number of Pumpkins and the x axis is labeled Days in October
Part A: Using computer software, a correlation coefficient of r = 0.51 was calculated. Based on the scatter plot, is that an accurate value for this data? Why or why not? (5 points)
Part B: Instead of comparing the number of pumpkins picked and the day in October, write a scenario that would be a causal relationship for pumpkins picked on the farm. (5 points

Answers: 1


Another question on Mathematics
Mathematics, 22.06.2019 02:00
16x^2-16x=5 solve the equation by completing the square
Answers: 3
Mathematics, 22.06.2019 03:00
The hockey team has been great! in 2008, they won 20% more games than in 2007 in 2009 they won 50% more games than in 2008 what was their overall percentage increase from 2007 through2008?
Answers: 1
Mathematics, 22.06.2019 03:10
Write the point slope form of the equation of the line passing through the points (-5, 6) and (0.1).
Answers: 2
You know the right answer?
Questions

English, 24.10.2020 20:30
Mathematics, 24.10.2020 20:30

Spanish, 24.10.2020 20:30

Chemistry, 24.10.2020 20:30

Computers and Technology, 24.10.2020 20:30
Mathematics, 24.10.2020 20:30
English, 24.10.2020 20:30


Computers and Technology, 24.10.2020 20:30
Mathematics, 24.10.2020 20:30
Mathematics, 24.10.2020 20:30
English, 24.10.2020 20:30
Mathematics, 24.10.2020 20:30
Mathematics, 24.10.2020 20:30


