
Mathematics, 12.02.2020 21:51 sleepqueen
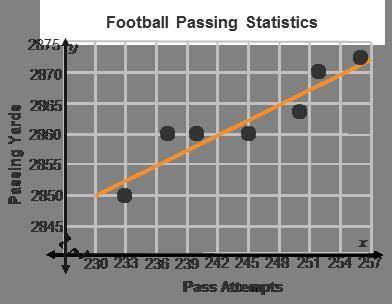
A graph titled Passing Statistics has pass attempts on the x-axis, and yards on the y-axis. A line goes through points (230, 2,850) and (242, 2,860).
The scatterplot and trend line show the number of pass attempts and passing yards a football team had during seven seasons.
Because none of the data points lie on the trend line, you must find two points on the line.
Point 1 can be .
Point 2 can be .
Using those two points, the slope of the line is .

Answers: 1


Another question on Mathematics
Mathematics, 21.06.2019 14:30
Suppose the radius of a circle is 16. what issuppose the radius of a circle is 16. what is its circumference its circumference
Answers: 2
Mathematics, 21.06.2019 15:00
1. are the triangles similar and if so why? what is the value of x? show your work.
Answers: 1
Mathematics, 21.06.2019 17:00
For which of the following counts would a binomial probability model not be reasonable? a)the number of people in a classroom born in januaryb) the number of people in a classroom with red hair c) the number of people admitted to a hospital in a day with a particular disease d) the number of heart beats in a one-minute perio.
Answers: 3
Mathematics, 21.06.2019 20:50
Find the equation of a line that is perpendicular to line g that contains (p, q). coordinate plane with line g that passes through the points negative 3 comma 6 and 0 comma 5 3x − y = 3p − q 3x + y = q − 3p x − y = p − q x + y = q − p
Answers: 1
You know the right answer?
A graph titled Passing Statistics has pass attempts on the x-axis, and yards on the y-axis. A line g...
Questions

Social Studies, 12.07.2019 13:00
Social Studies, 12.07.2019 13:00


Mathematics, 12.07.2019 13:00
History, 12.07.2019 13:00
Mathematics, 12.07.2019 13:00
History, 12.07.2019 13:00
Physics, 12.07.2019 13:00
Social Studies, 12.07.2019 13:00
Social Studies, 12.07.2019 13:00

Health, 12.07.2019 13:00
Social Studies, 12.07.2019 13:00


