(IS IT A. B. C. OR D.)
The box plots show the target heart rates of men 20–40 years old and men...

Mathematics, 14.02.2020 02:48 NycLife
(IS IT A. B. C. OR D.)
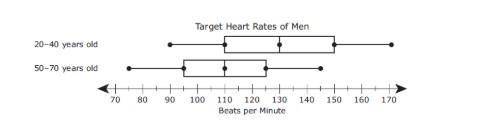
The box plots show the target heart rates of men 20–40 years old and men 50–70 years old.
Which statement is best supported by the information in the box plots?
A) The range of the data for men 20–40 years old is less than the range of the data for men 50–70 years old.
B) The median of the data for men 20–40 years old is less than the median of the data for men 50–70 years old.
C) The minimum target heart rate for men 20–40 years old is less than the minimum target heart rate for men 50–70 years old.
D) The interquartile range of the data for men 20–40 years old is greater than the interquartile range of the data for men 50–70 years old.

Answers: 3


Another question on Mathematics
Mathematics, 21.06.2019 16:00
Which term best describes the association between variables a and b? no association a negative linear association a positive linear association a nonlinear association a scatterplot with an x axis labeled, variable a from zero to ten in increments of two and the y axis labeled, variable b from zero to one hundred forty in increments of twenty with fifteen points in a positive trend.
Answers: 2
Mathematics, 21.06.2019 20:00
1: 4 if the wew 35 surfboards at the beach how many were short boards?
Answers: 1
Mathematics, 21.06.2019 23:20
Using only the digits 5, 6, 7, 8, how many different three digit numbers can be formed if no digit is repeated in a number?
Answers: 1
You know the right answer?
Questions
Mathematics, 19.08.2020 14:01
Engineering, 19.08.2020 14:01

Mathematics, 19.08.2020 14:01

Chemistry, 19.08.2020 14:01
Mathematics, 19.08.2020 14:01
Mathematics, 19.08.2020 14:01
Mathematics, 19.08.2020 14:01

History, 19.08.2020 14:01
Mathematics, 19.08.2020 14:01
Mathematics, 19.08.2020 14:01
Mathematics, 19.08.2020 14:01
Mathematics, 19.08.2020 14:01


