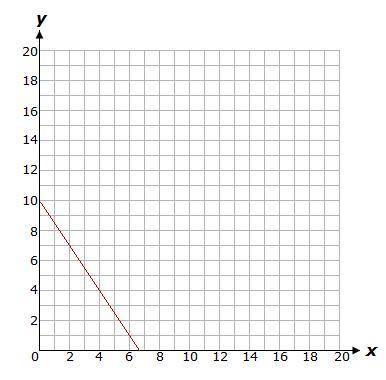
Which situation is best represented by the function in the graph?
A.
the demand for a c...

Mathematics, 14.02.2020 18:30 eric271828
Which situation is best represented by the function in the graph?
A.
the demand for a car as its price increases
B.
the temperature on a thermometer throughout a warm day
C.
the amount of water in a bottle as it is being filled
D.
the height of a ball in the seconds after it leaves a pitcher's hand

Answers: 1


Another question on Mathematics
Mathematics, 21.06.2019 20:30
Astore ordered 750 candles a total wholesale cost of $7910.20. the soy candles cosy $12.17 each and thespecialty candles cost $9.58each. how many of each were bought?
Answers: 1
Mathematics, 21.06.2019 23:00
Graph the system of equations. {6x−4y=−244x−8y=−32 use the line tool to graph the lines.
Answers: 1
Mathematics, 22.06.2019 00:00
Which of the following will form the composite function?
Answers: 3
Mathematics, 22.06.2019 02:00
Pleasseee important quick note: enter your answer and show all the steps that you use to solve this problem in the space provided. use the circle graph shown below to answer the question. a pie chart labeled favorite sports to watch is divided into three portions. football represents 42 percent, baseball represents 33 percent, and soccer represents 25 percent. if 210 people said football was their favorite sport to watch, how many people were surveyed?
Answers: 2
You know the right answer?
Questions


Mathematics, 07.12.2019 07:31
Mathematics, 07.12.2019 07:31

Mathematics, 07.12.2019 07:31
Mathematics, 07.12.2019 07:31

Chemistry, 07.12.2019 07:31
Mathematics, 07.12.2019 07:31


History, 07.12.2019 07:31
Social Studies, 07.12.2019 07:31


