
Mathematics, 19.02.2020 23:00 zimbabwayjerry
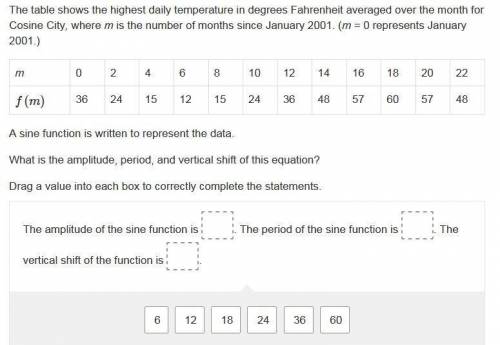
The table shows the highest daily temperature in degrees Fahrenheit averaged over the month for Cosine City, where m is the number of months since January 2001. (m = 0 represents January 2001.)
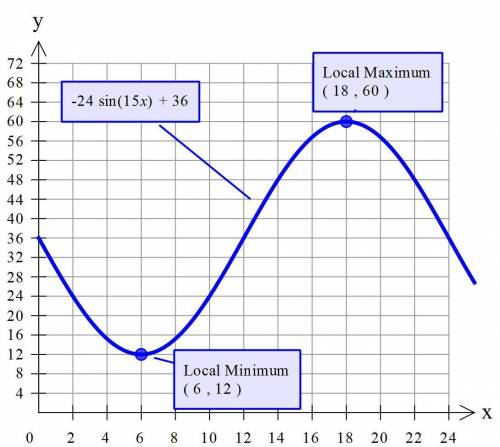
A sine function is written to represent the data.
What is the amplitude, period, and vertical shift of this equation?
Drag a value into each box to correctly complete the statements.

Answers: 2


Another question on Mathematics
Mathematics, 22.06.2019 01:50
If its non of them tell me..valerie took a day-trip. she drove from her house for a while and took a coffee break. after her coffee break, she continued driving. after 2 hours of driving after her coffee break, her distance from her house was 210 miles. her average speed during the whole trip was 60 miles per hour.valerie created the equation y−210=60(x−2) to represent this situation, where xx represents the time in hours from her coffee break and yy represents the distance in miles from her house.which graph correctly represents valerie's distance from her house after her coffee break?
Answers: 1
Mathematics, 22.06.2019 02:00
1. the manager of collins import autos believes the number of cars sold in a day (q) depends on two factors: (1) the number of hours the dealership is open (h) and (2) the number of salespersons working that day (s). after collecting data for two months (53 days), the manager estimates the following log-linear model: q 4 equation 1 a. explain, how to transform the log-linear model into linear form that can be estimated using multiple regression analysis. the computer output for the multiple regression analysis is shown below: q4 table b. how do you interpret coefficients b and c? if the dealership increases the number of salespersons by 20%, what will be the percentage increase in daily sales? c. test the overall model for statistical significance at the 5% significance level. d. what percent of the total variation in daily auto sales is explained by this equation? what could you suggest to increase this percentage? e. test the intercept for statistical significance at the 5% level of significance. if h and s both equal 0, are sales expected to be 0? explain why or why not? f. test the estimated coefficient b for statistical significance. if the dealership decreases its hours of operation by 10%, what is the expected impact on daily sales?
Answers: 2
Mathematics, 22.06.2019 04:30
In which month was the peak, the largest deposit, made? january june july august
Answers: 1
You know the right answer?
The table shows the highest daily temperature in degrees Fahrenheit averaged over the month for Cosi...
Questions


History, 26.07.2019 21:00


Physics, 26.07.2019 21:00

Biology, 26.07.2019 21:00


