
Mathematics, 20.02.2020 04:52 briannalv0814
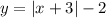
The graph of y = StartAbsoluteValue x EndAbsoluteValue is transformed as shown in the graph below. Which equation represents the transformed function?
On a coordinate plane, an absolute value function is shown. The vertex of the function is at (negative 3, negative 2). It crosses the x-axis at (negative 5, 0) and (negative 1, 0) and it crosses the y-axis at (0, 1).
y = StartAbsoluteValue x minus 3 EndAbsoluteValue + 2
y = StartAbsoluteValue x + 3 EndAbsoluteValue minus 2
y = StartAbsoluteValue x minus 2 EndAbsoluteValue + 3
y = StartAbsoluteValue x + 2 EndAbsoluteValue minus 3

Answers: 2
 g(-5) = |-5 + 3} - 2 = 2 - 2 = 0 ⇒ (-5,0)

Another question on Mathematics
Mathematics, 21.06.2019 18:00
Based on the graph, what is the initial value of the linear relationship? a coordinate plane is shown. a line passes through the y-axis at -2 and the x-axis at 3.
Answers: 3
Mathematics, 21.06.2019 23:00
The sum of 5consecutive even numbers is 100. what is the first number in this sequence?
Answers: 1
Mathematics, 22.06.2019 02:30
Robert has 78 tomatoes and 56 cucumbers he wants to plant them in equal rows how many in each row
Answers: 1
You know the right answer?
The graph of y = StartAbsoluteValue x EndAbsoluteValue is transformed as shown in the graph below. W...
Questions

English, 24.03.2020 19:11
Mathematics, 24.03.2020 19:11


History, 24.03.2020 19:12
Mathematics, 24.03.2020 19:12

Social Studies, 24.03.2020 19:12
Mathematics, 24.03.2020 19:12

Computers and Technology, 24.03.2020 19:12

Chemistry, 24.03.2020 19:12
Mathematics, 24.03.2020 19:12


