
Mathematics, 20.02.2020 07:46 0prayforthelost0
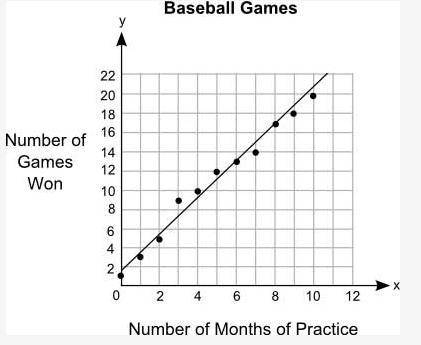
The graph shows the relationship between the number of months different students practiced baseball and the number of games they won: (look at image attached)
Part A: What is the approximate y-intercept of the line of best fit and what does it represent? (5 points)
Part B: Write the equation for the line of best fit in slope-intercept form and use it to predict the number of games that could be won after 13 months of practice. Show your work and include the points used to calculate the slope. (5 points)

Answers: 3


Another question on Mathematics
Mathematics, 21.06.2019 21:40
The sides of a parallelogram are 24cm and 16cm. the distance between the 24cm sides is 8 cm. find the distance between the 16cm sides
Answers: 3
Mathematics, 21.06.2019 22:00
What is the value of the discriminant of the quadratic equation -2x = -8x + 8 and what does its value mean about thenumber of real number solutions the equation has?
Answers: 3
You know the right answer?
The graph shows the relationship between the number of months different students practiced baseball...
Questions

Biology, 28.01.2020 23:59
Mathematics, 28.01.2020 23:59
Mathematics, 28.01.2020 23:59
Mathematics, 29.01.2020 00:00
Mathematics, 29.01.2020 00:00

History, 29.01.2020 00:00
Mathematics, 29.01.2020 00:00

Spanish, 29.01.2020 00:00
Mathematics, 29.01.2020 00:00
Mathematics, 29.01.2020 00:00

Physics, 29.01.2020 00:00

Geography, 29.01.2020 00:00
Mathematics, 29.01.2020 00:00

Social Studies, 29.01.2020 00:00

History, 29.01.2020 00:00


