(image attatched!)
A food truck did a daily survey of customers to find their food prefer...

Mathematics, 20.02.2020 08:17 hernandezbrandon059
(image attatched!)
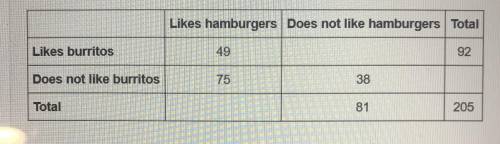
A food truck did a daily survey of customers to find their food preferences. The data is partially entered in the frequency table. Complete the table to analyze the data and answer the questions:
Likes hamburgers Does not like hamburgers
Likes hamburgers
Does not like hamburgers
Total
Likes burritos
49
92
Does not like burritos
75
38
Total
81
205
Part A: What percentage of the survey respondents did not like either hamburgers or burritos? (2 points)
Part B: Create a relative frequency table and determine what percentage of students who like hamburgers also like burritos. (3 points)
Part C: Use the conditional relative frequencies to determine which two data point has strongest association of its two factors. Use complete sentences to explain your answer. (5 points)

Answers: 1


Another question on Mathematics
Mathematics, 21.06.2019 14:40
3× __ -2=15 7 2× __+1=7 5 7× =22 15 5× __+10=2 8 × __+4=20 6 × =10 3 × __+2=8 6 × __+8=8 9 × __+7=20 6
Answers: 3
Mathematics, 21.06.2019 20:30
In priyas math class there are 10 boys and 15 girls. what is the ratio of boys to girls in priyas math class? express your answer as a decimal
Answers: 1
Mathematics, 21.06.2019 23:20
Which expression is a factor of 12x2 + 29x – 8? x – 8 2x – 1 3x + 8 4x + 1
Answers: 1
You know the right answer?
Questions
Mathematics, 21.10.2020 21:01

History, 21.10.2020 21:01

Advanced Placement (AP), 21.10.2020 21:01

Spanish, 21.10.2020 21:01


Computers and Technology, 21.10.2020 21:01
Mathematics, 21.10.2020 21:01
History, 21.10.2020 21:01

Physics, 21.10.2020 21:01

Health, 21.10.2020 21:01


Social Studies, 21.10.2020 21:01
History, 21.10.2020 21:01
Mathematics, 21.10.2020 21:01


