

(50 Points + Brainliest, Please help fast!!)
A food truck did a daily survey of customer...

Mathematics, 20.02.2020 17:55 youngsavage10120
(50 Points + Brainliest, Please help fast!!)
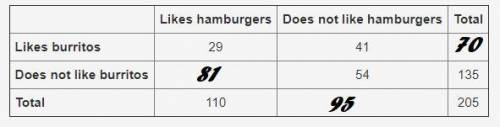
A food truck did a daily survey of customers to find their food preferences. The data is partially entered in the frequency table. Complete the table to analyze the data and answer the questions:
Part A: What percentage of the survey respondents did not like either hamburgers or burritos?
Part B: Create a relative frequency table and determine what percentage of students who like hamburgers also like burritos.
Part C: Use the conditional relative frequencies to determine which two data point has strongest association of its two factors. Use complete sentences to explain your answer.

Answers: 3


Another question on Mathematics
Mathematics, 21.06.2019 12:50
Amonument at a park is in the shape of a right square pyramid. a diagram of the pyramid and its net are shown. what is the surface area of the monument? enter the answer in the box. m²
Answers: 2
Mathematics, 21.06.2019 19:30
Two variables, x and y, vary inversely, and x=12 when y=4. what is the value of y when x=3?
Answers: 1
You know the right answer?
Questions

Mathematics, 08.10.2019 02:30

History, 08.10.2019 02:30

Health, 08.10.2019 02:30
Mathematics, 08.10.2019 02:30


Social Studies, 08.10.2019 02:30

Chemistry, 08.10.2019 02:30

Mathematics, 08.10.2019 02:30


