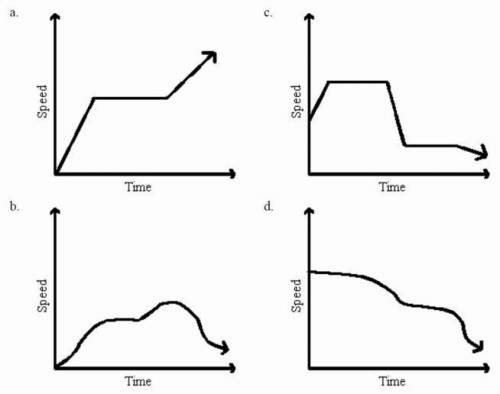
GIVING BRAINLIEST Referring to the figure, determine which of the following graphs
best d...

Mathematics, 20.02.2020 19:59 emily743
GIVING BRAINLIEST Referring to the figure, determine which of the following graphs
best depicts this situation: Antonio rode a sled down from the top of
the hill. He began to pick up speed until he rode over a level spot on
the hill. Then his speed began to increase again as he rode down the
remainder of the hill. He gradually slowed to a stop at the bottom of
the hill. Which graph best illustrates Antonio's speed?
a. Graph a c. Graph c
b. Graph b d. Graph d


Answers: 1


Another question on Mathematics

Mathematics, 21.06.2019 15:40
Given the following sampling distribution of one mean with a sample size 49, from a normally distributed population,find the population standard deviation, o.79828588912497
Answers: 3

Mathematics, 21.06.2019 16:00
Given right triangle xyz, which correctly describes the locations of the sides in relation to
Answers: 1

Mathematics, 21.06.2019 22:00
1. how do you convert the repeating, nonterminating decimal 0. to a fraction? explain the process as you solve the problem.
Answers: 2

Mathematics, 22.06.2019 04:00
If the square of a positive integer is added to 2 times the integer the result is 48. find the integer.
Answers: 1
You know the right answer?
Questions


Biology, 20.10.2019 11:00

History, 20.10.2019 11:00


Social Studies, 20.10.2019 11:00

Mathematics, 20.10.2019 11:00


History, 20.10.2019 11:00


Mathematics, 20.10.2019 11:00

Mathematics, 20.10.2019 11:00

Health, 20.10.2019 11:00


