
Mathematics, 22.02.2020 00:21 aminamuhammad11
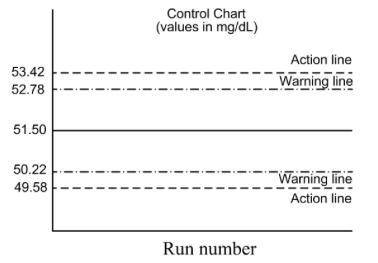
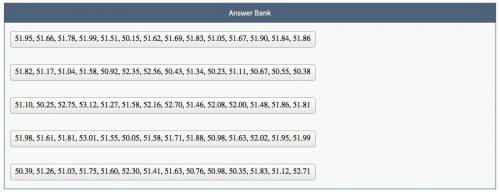
A control chart is developed to monitor the analysis of iron levels in human blood. The lines on the control chart were obtained from a control sample with a population mean, μ, of 51.50 mg/dL and a population standard deviation, σ, of 3.50 mg/dL.
To monitor the analysis of the iron levels, the laboratory measured 30 replicate control samples every day. Lists of the mean values of the 30 replicate control samples measured every day over a series of 14 consecutive days (runs) are given.
Classify the lists of mean values based on whether they indicate the process should be shut down for troubleshooting or not.

Answers: 1


Another question on Mathematics
Mathematics, 21.06.2019 16:20
Taking algebra two apex courses and need with these questions
Answers: 1
Mathematics, 21.06.2019 19:00
You give a $4 tip for a meal that cost $22. approximately what percent of the bill was your tip?
Answers: 1
Mathematics, 21.06.2019 21:00
Evaluate this using ! 0.25^2 x 2.4 + 0.25 x 2.4^2 − 0.25 x 2.4 x 0.65
Answers: 1
You know the right answer?
A control chart is developed to monitor the analysis of iron levels in human blood. The lines on the...
Questions

Physics, 23.08.2019 15:20

History, 23.08.2019 15:20


English, 23.08.2019 15:20

Mathematics, 23.08.2019 15:20
Mathematics, 23.08.2019 15:20
Mathematics, 23.08.2019 15:20
Mathematics, 23.08.2019 15:20
Biology, 23.08.2019 15:20
Mathematics, 23.08.2019 15:20


