
Mathematics, 22.02.2020 04:33 ineemorehelp
A law school administrator was interested in whether a student's score on the entrance exam can be used to predict a student's grade point average (GPA) after one year of law school. The administrator studied 15 students. It was shown that the correlation between the entrance exam score and the grade point average after one year of law school was 0.934. Based on this information, interpret the correlation coefficient.

Answers: 2
 who represent the determination coefficient and we got:
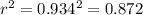
![r=\frac{n(\sum xy)-(\sum x)(\sum y)}{\sqrt{[n\sum x^2 -(\sum x)^2][n\sum y^2 -(\sum y)^2]}}](/tpl/images/0520/1401/ec454.png)


Another question on Mathematics
Mathematics, 21.06.2019 16:40
Which of the following statement about pascal's triangle are true?
Answers: 1
Mathematics, 21.06.2019 22:10
Use the spider tool located on page 1 of this activity to draw a 12-pointed star for the new logo. (hint: if the spider rotates 360 degrees -- or 720 degrees or 1080 degrees -- she will be facing in the same direction in which she started. when the spider is done drawing, you want her to be facing in the same direction in which she started. she'll be making 12 rotations, all the same size, so each rotation must be some multiple of 360/12 = 30 degrees.) urgently. been stuck on this problem for around 45 minutes now.! it should be easy if you're smart enough
Answers: 3
Mathematics, 21.06.2019 23:40
Agrid shows the positions of a subway stop and your house. the subway stop is located at (-5,2) and your house is located at (-9,9). what is the distance, to the nearest unit, between your house and the subway stop?
Answers: 1
Mathematics, 22.06.2019 01:00
The weight of 46 new patients of a clinic from the year 2018 are recorded and listed below. construct a frequency distribution, using 7 classes. then, draw a histogram, a frequency polygon, and an ogive for the data, using the relative information from the frequency table for each of the graphs. describe the shape of the histogram. data set: 130 192 145 97 100 122 210 132 107 95 210 128 193 208 118 196 130 178 187 240 90 126 98 194 115 212 110 225 187 133 220 218 110 104 201 120 183 124 261 270 108 160 203 210 191 180 1) complete the frequency distribution table below (add as many rows as needed): - class limits - class boundaries - midpoint - frequency - cumulative frequency 2) histogram 3) frequency polygon 4) ogive
Answers: 1
You know the right answer?
A law school administrator was interested in whether a student's score on the entrance exam can be u...
Questions

Biology, 03.08.2019 16:00
Mathematics, 03.08.2019 16:00

History, 03.08.2019 16:00
History, 03.08.2019 16:00
Mathematics, 03.08.2019 16:00
Mathematics, 03.08.2019 16:00
Mathematics, 03.08.2019 16:00

Social Studies, 03.08.2019 16:00
Biology, 03.08.2019 16:00

Mathematics, 03.08.2019 16:00
History, 03.08.2019 16:00


