PLEASE ANSWER
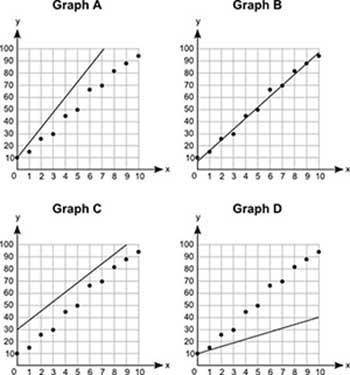
Four graphs are shown below:
Which graph best shows the line o...

Mathematics, 22.02.2020 06:39 july00
PLEASE ANSWER
Four graphs are shown below:
Which graph best shows the line of best fit?
A. Graph A
B. Graph B
C. Graph C
D. Graph D

Answers: 2


Another question on Mathematics
Mathematics, 21.06.2019 15:00
Listed in the table is the percentage of students who chose each kind of juice at lunchtime. use the table to determine the measure of the central angle you would draw to represent orange juice in a circle graph
Answers: 3
Mathematics, 21.06.2019 22:00
What is the equation of the line that is parallel to the line with the equation y= -3/4x +1 and passes through the point (12,-12)
Answers: 1
Mathematics, 22.06.2019 00:50
The students in a class were asked how many siblings they have. the data obtained is represented in the dot plot. the number of students who have no siblings is . the number of students who have three or more siblings is .
Answers: 1
Mathematics, 22.06.2019 01:30
Jahdzia wears her winter coat when the temperature is colder than -4 degrees celsius. write an inequality that is true only for temperatures (t) at which jahdzia wears her winter coat.
Answers: 3
You know the right answer?
Questions


Biology, 19.02.2020 03:44

Mathematics, 19.02.2020 03:44


Chemistry, 19.02.2020 03:44

Mathematics, 19.02.2020 03:44

Social Studies, 19.02.2020 03:44
Mathematics, 19.02.2020 03:44
Mathematics, 19.02.2020 03:45


